Debugging Auto-Device Plugin
Using Debug Log
In case of execution problems, just like all other plugins, Auto-Device provides the user with information on exceptions and error values. If the returned data is not enough for debugging purposes, more information may be acquired by means of ov::log::Level.
There are six levels of logs, which can be called explicitly or set via the OPENVINO_LOG_LEVEL environment variable (can be overwritten by compile_model() or set_property()):
    core = ov.Core()

    # compile a model on AUTO and set log level to debug
    compiled_model = core.compile_model(
        model=model,
        device_name="AUTO",
        config={log.level: log.Level.DEBUG},
    )
    # set log level with set_property and compile model
    core.set_property(
        device_name="AUTO",
        properties={log.level: log.Level.DEBUG},
    )
    compiled_model = core.compile_model(model=model, device_name="AUTO")
ov::Core core;

// read a network in IR, PaddlePaddle, or ONNX format
std::shared_ptr<ov::Model> model = core.read_model("sample.xml");

// compile a model on AUTO and set log level to debug
ov::CompiledModel compiled_model = core.compile_model(model, "AUTO", ov::log::level(ov::log::Level::DEBUG));

// or set log level with set_property and compile model
core.set_property("AUTO", ov::log::level(ov::log::Level::DEBUG));
ov::CompiledModel compiled_model2 = core.compile_model(model, "AUTO");
When defining it via the variable,
a number needs to be used instead of a log level name, e.g.:

Linux
export OPENVINO_LOG_LEVEL=0

Windows
set OPENVINO_LOG_LEVEL=0
The property returns information in the following format:
[time]LOG_LEVEL[file] [PLUGIN]: message
in which the LOG_LEVEL is represented by the first letter of its name (ERROR being an exception and using its full name). For example:
[17:09:36.6188]D[plugin.cpp:167] deviceName:GPU, defaultDeviceID:, uniqueName:GPU_
[17:09:36.6242]I[executable_network.cpp:181] [AUTOPLUGIN]:select device:GPU
[17:09:36.6809]ERROR[executable_network.cpp:384] [AUTOPLUGIN] load failed, GPU:[ GENERAL_ERROR ]
Instrumentation and Tracing Technology
All major performance calls of both OpenVINO™ Runtime and the AUTO plugin are instrumented with Instrumentation and Tracing Technology (ITT) APIs. To enable ITT in OpenVINO™ Runtime, compile it with the following option:
-DENABLE_PROFILING_ITT=ON
For more information, you can refer to:
Analyze Code Performance on Linux
You can analyze code performance using Intel® VTune™ Profiler. For more information and installation instructions refer to the installation guide (PDF) With Intel® VTune™ Profiler installed you can configure your analysis with the following steps:
Open Intel® VTune™ Profiler GUI on the host machine with the following command:
cd /vtune install dir/intel/oneapi/vtune/2021.6.0/env
source vars.sh
vtune-gui
Select Configure Analysis
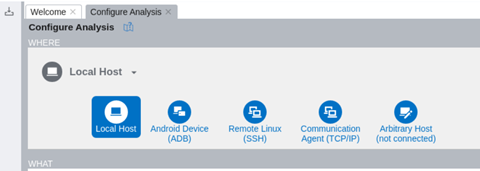
In the where pane, select Local Host
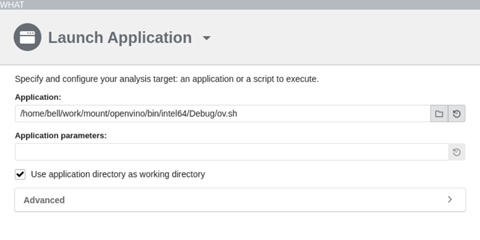
In the what pane, specify your target application/script on the local system.
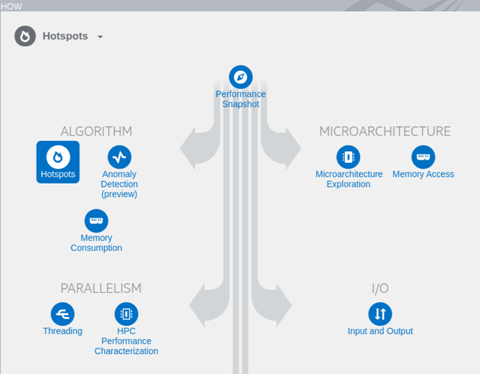
In the how pane, choose and configure the analysis type you want to perform, for example, Hotspots Analysis: identify the most time-consuming functions and drill down to see time spent on each line of source code. Focus optimization efforts on hot code for the greatest performance impact.
Start the analysis by clicking the start button. When it is done, you will get a summary of the run, including top hotspots and top tasks in your application:
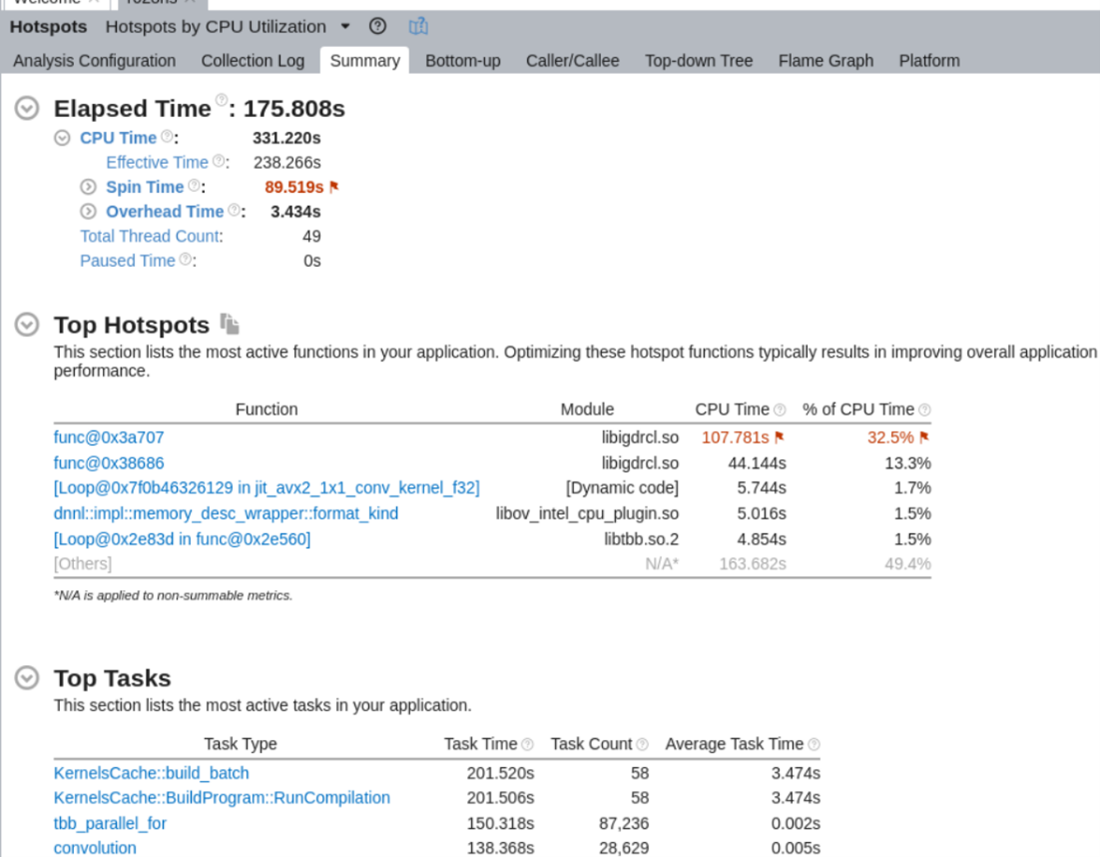
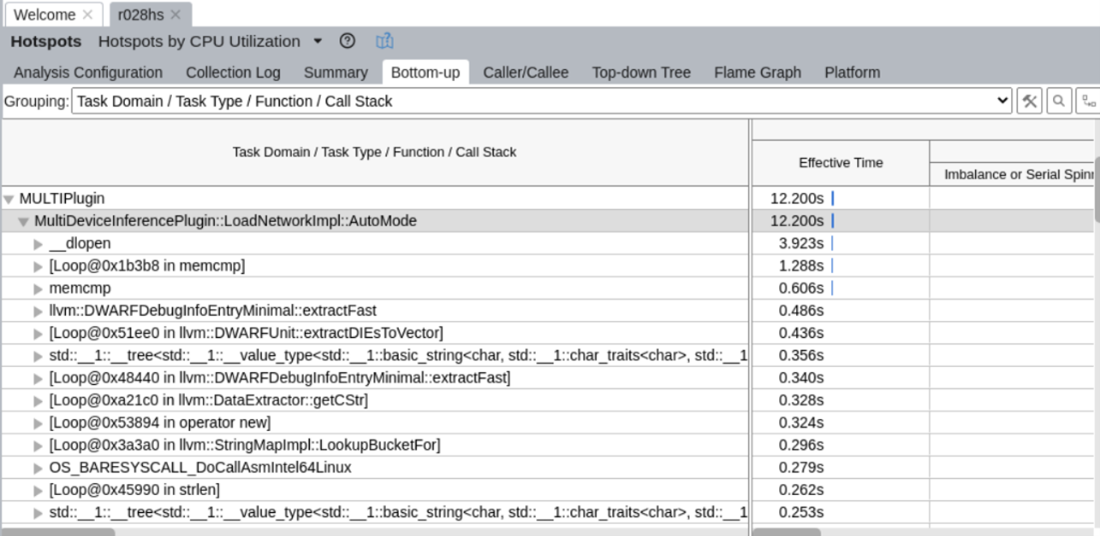
To analyze ITT info related to the Auto plugin, click on the Bottom-up tab, choose the Task Domain/Task Type/Function/Call Stack from the dropdown list - Auto plugin-related ITT info is under the MULTIPlugin task domain:
