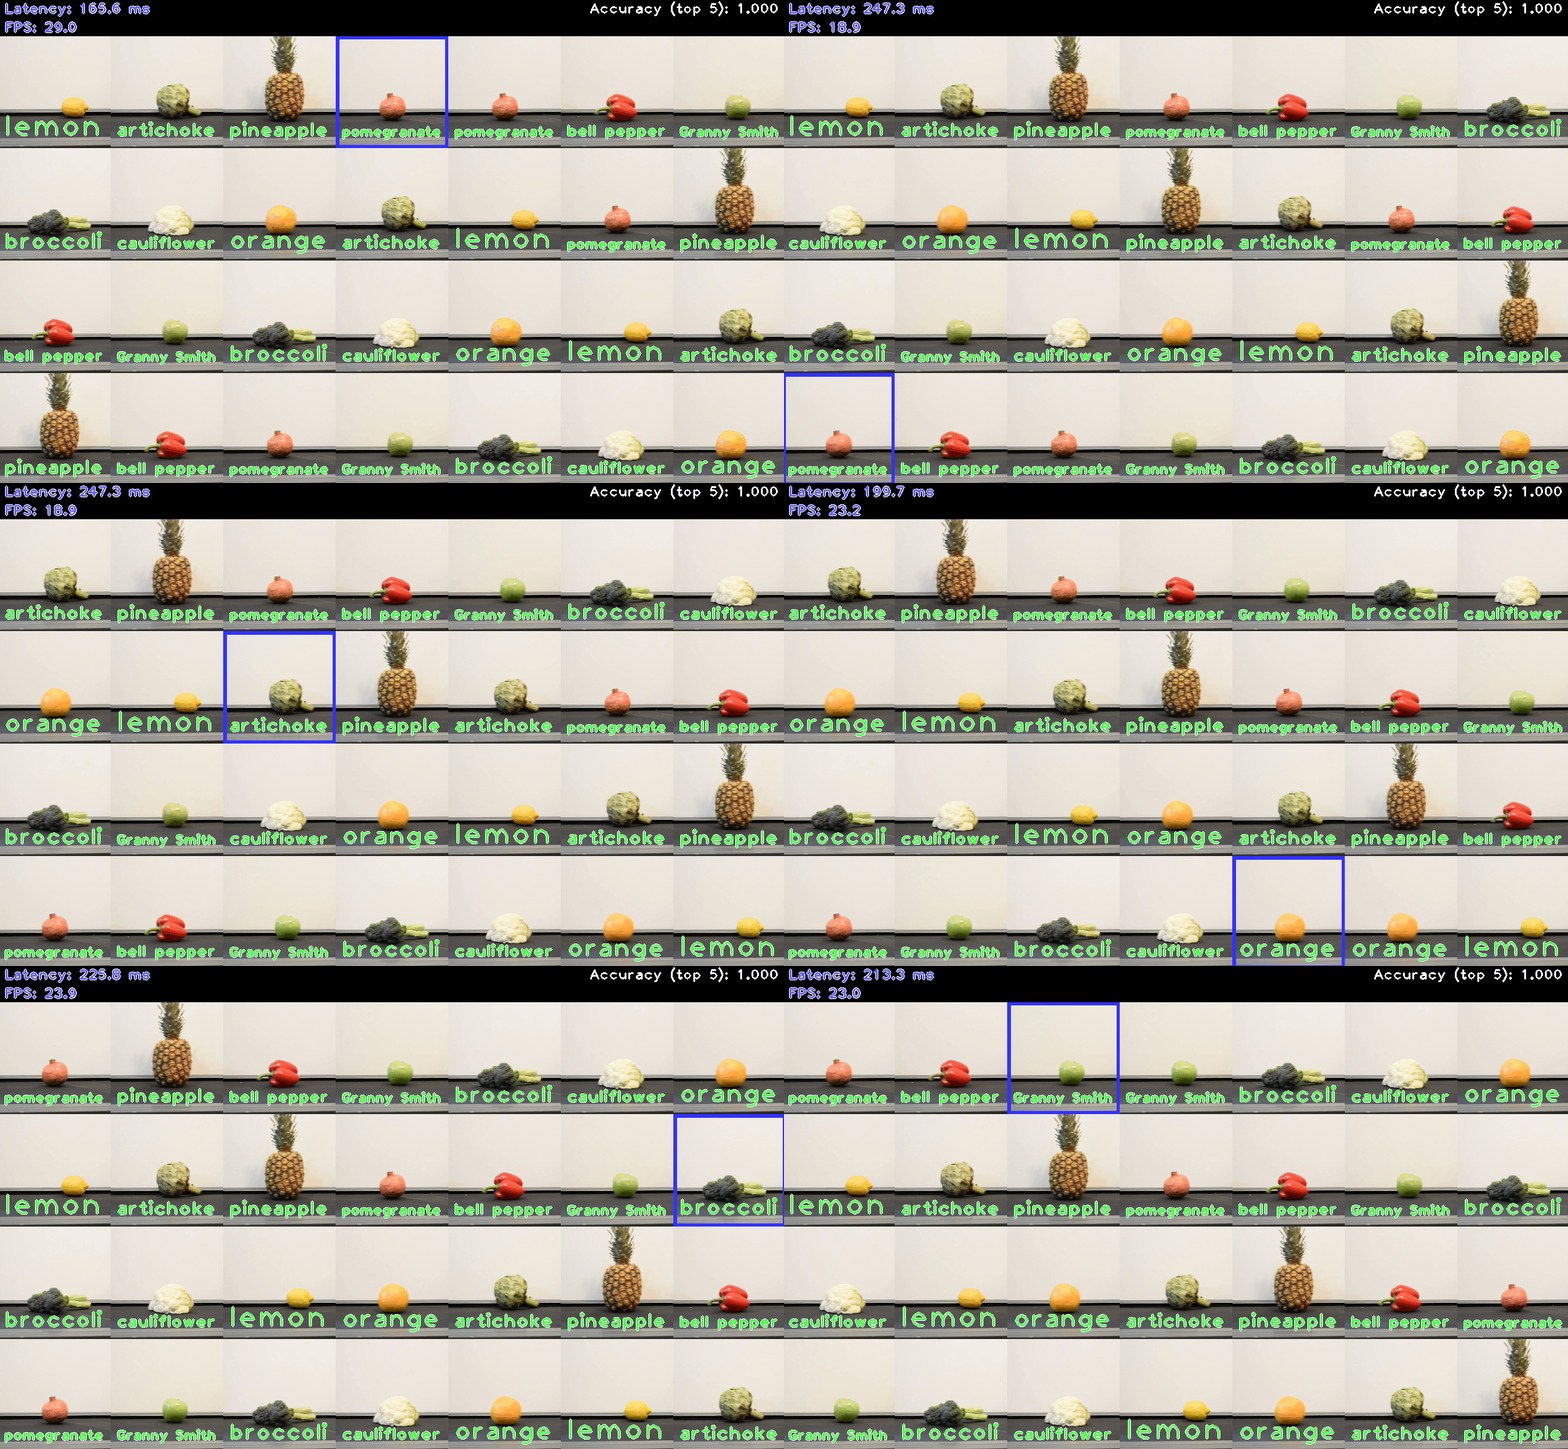
Classification Benchmark C++ Demo#

The demo visualizes OpenVINO performance on inference of neural networks for image classification.
How It Works#
On startup, the application reads command line parameters and loads a classification model to OpenVINO™ Runtime plugin for execution. It might take some time for demo to read all input images. Then the demo performs inference to classify the images and places them on grid.
The demo starts in “Testing mode” with fixed grid size. After calculating the average FPS result, it will switch to normal mode and grid will be readjusted depending on model performance. Bigger grid means higher performance. You can repeat testing by pressing “Space” or “R” button.
When “ground truth” data is applied, the color coding for the text, drawn above each image, shows whether the classification was correct: green means correct class prediction, red means wrong.
You can stop the demo by pressing “Esc” or “Q” button. After that, the average metrics values will be printed to the console.
NOTE: By default, Open Model Zoo demos expect input with BGR channels order. If you trained your model to work with RGB order, you need to manually rearrange the default channels order in the demo application or reconvert your model using the Model Optimizer tool with the
--reverse_input_channelsargument specified. For more information about the argument, refer to When to Reverse Input Channels section of [Embedding Preprocessing Computation](@ref openvino_docs_MO_DG_Additional_Optimization_Use_Cases).
Preparing to Run#
The list of models supported by the demo is in <omz_dir>/demos/classification_benchmark_demo/cpp/models.lst file.
This file can be used as a parameter for Model Downloader and Converter to download and, if necessary, convert models to OpenVINO IR format (*.xml + *.bin).
An example of using the Model Downloader:
omz_downloader --list models.lst
An example of using the Model Converter:
omz_converter --list models.lst
Supported Models#
convnext-tiny
densenet-121-tf
dla-34
efficientnet-b0
efficientnet-b0-pytorch
efficientnet-v2-b0
efficientnet-v2-s
googlenet-v1-tf
googlenet-v2-tf
googlenet-v3
googlenet-v3-pytorch
googlenet-v4-tf
hbonet-0.25
hbonet-1.0
inception-resnet-v2-tf
levit-128s
mixnet-l
mobilenet-v1-0.25-128
mobilenet-v1-1.0-224-tf
mobilenet-v2-1.0-224
mobilenet-v2-1.4-224
mobilenet-v2-pytorch
mobilenet-v3-large-1.0-224-tf
mobilenet-v3-small-1.0-224-tf
nfnet-f0
regnetx-3.2gf
repvgg-a0
repvgg-b1
repvgg-b3
resnest-50-pytorch
resnet-18-pytorch
resnet-34-pytorch
resnet-50-pytorch
resnet-50-tf
resnet18-xnor-binary-onnx-0001
resnet50-binary-0001
rexnet-v1-x1.0
shufflenet-v2-x1.0
swin-tiny-patch4-window7-224
t2t-vit-14
NOTE: Refer to the tables Intel’s Pre-Trained Models Device Support and Public Pre-Trained Models Device Support for the details on models inference support at different devices.
Required Files#
If you want to see classification results, you must use “-gt” and “-labels” flags to specify two .txt files containing lists of classes and labels.
“The ground truth” file is used for matching image file names with correct object classes.
It has the following format:
./ILSVRC2012_val_00000001.JPEG 65
./ILSVRC2012_val_00000002.JPEG 970
./ILSVRC2012_val_00000003.JPEG 230
...
Class index values must be in range from 0 to 1000. If you want to use “other” class, which is supported only by a small subset of models, specify it with -1 index.
“Labels” file contains the list of human-readable labels, one line for each class.
and <omz_dir>/data/dataset_classes/imagenet_2012.txt labels file with all other models supported by the demo.
Running#
Running the demo with -h shows this help message:
classification_benchmark_demo [OPTION]
Options:

    -h                        Print a usage message.
    -i "<path>"               Required. Path to a folder with images or path to an image file.
    -m "<path>"               Required. Path to an .xml file with a trained model.
    -auto_resize              Optional. Enables resizable input.
    -labels "<path>"          Required. Path to .txt file with labels.
    -layout "<string>"        Optional. Specify inputs layouts. Ex. NCHW or input0:NCHW,input1:NC in case of more than one input.
    -gt "<path>"              Optional. Path to ground truth .txt file.
    -d "<device>"             Optional. Specify the target device to infer on (the list of available devices is shown below). Default value is CPU. The demo will look for a suitable plugin for device specified.
    -nthreads "<integer>"     Optional. Specify count of threads.
    -nstreams "<integer>"     Optional. Specify count of streams.
    -nireq "<integer>"        Optional. Number of infer requests.
    -nt "<integer>"           Optional. Number of top results. Default value is 5. Must be >= 1.
    -res "<WxH>"              Optional. Set image grid resolution in format WxH. Default value is 1280x720.
    -no_show                  Optional. Disable showing of processed images.
    -time "<integer>"         Optional. Time in seconds to execute program. Default is -1 (infinite time).
    -u                        Optional. List of monitors to show initially.
    -reverse_input_channels   Optional. Switch the input channels order from BGR to RGB.
    -mean_values              Optional. Normalize input by subtracting the mean values per channel. Example: "255.0 255.0 255.0"
    -scale_values             Optional. Divide input by scale values per channel. Division is applied after mean values subtraction. Example: "255.0 255.0 255.0"
The number of InferRequests is specified by -nireq flag. Each InferRequest acts as a “buffer”: it waits in queue before being filled with images and sent for inference, then after the inference completes, it waits in queue until its results are processed. Increasing the number of InferRequests usually increases performance, because in that case multiple InferRequests can be processed simultaneously if the device supports parallelization. However, big number of InferRequests increases latency because each image still needs to wait in queue.
For higher FPS, it is recommended to use -nireq which slightly exceeds -nstreams value summed over all used devices.
For example, use the following command-line command to run the application:
./classification_benchmark_demo -m <path_to_classification_model> \
                      -i <path_to_folder_with_images> \
                      -labels <path_to_file_with_list_of_labels> \
                      -gt <path_to_ground_truth_data_file> \
                      -u CDM
Demo Output#
The demo uses OpenCV to display the resulting image grid with classification results presented as a text above images. The demo reports:
FPS: average rate of video frame processing (frames per second).
Latency: average time required to process one frame (from reading the frame to displaying the results).
Latency for each of the following pipeline stages:
Decoding — capturing input data.
Preprocessing — data preparation for inference.
Inference — infering input data (images) and getting a result.
Postrocessing — preparation inference result for output.
Rendering — generating output image.
You can use these metrics to measure application-level performance.