DL Workbench enables you to visually estimate how well a model recognizes images by testing the model on particular sample images. This functionality considerably enhances the analysis of inference results, giving you an opportunity not only to estimate the performance, but also to visually understand whether the model works correctly and the accuracy is tolerable for client applications.
To get a visual representation of the output of your model, go to the Test tab on the Selected Configuration tab of the Configurations page.
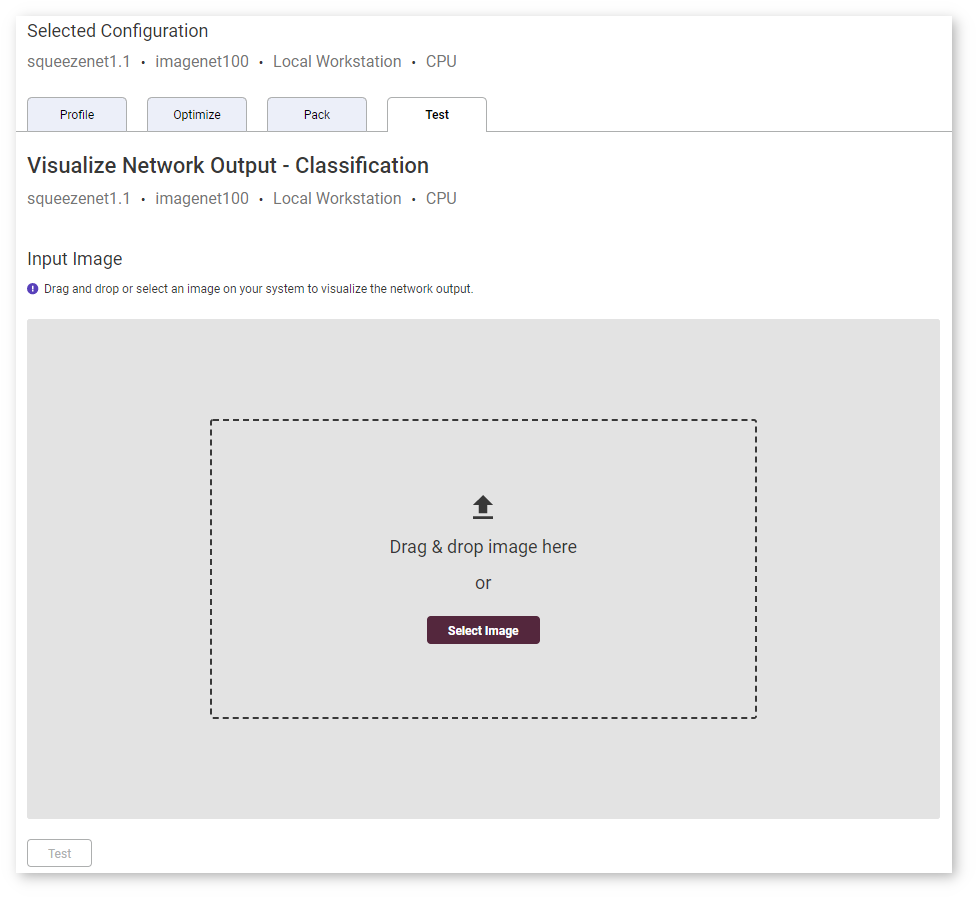
Select an image on your system or drag and drop an image directly. Click Test, and the model predictions appear on the right.
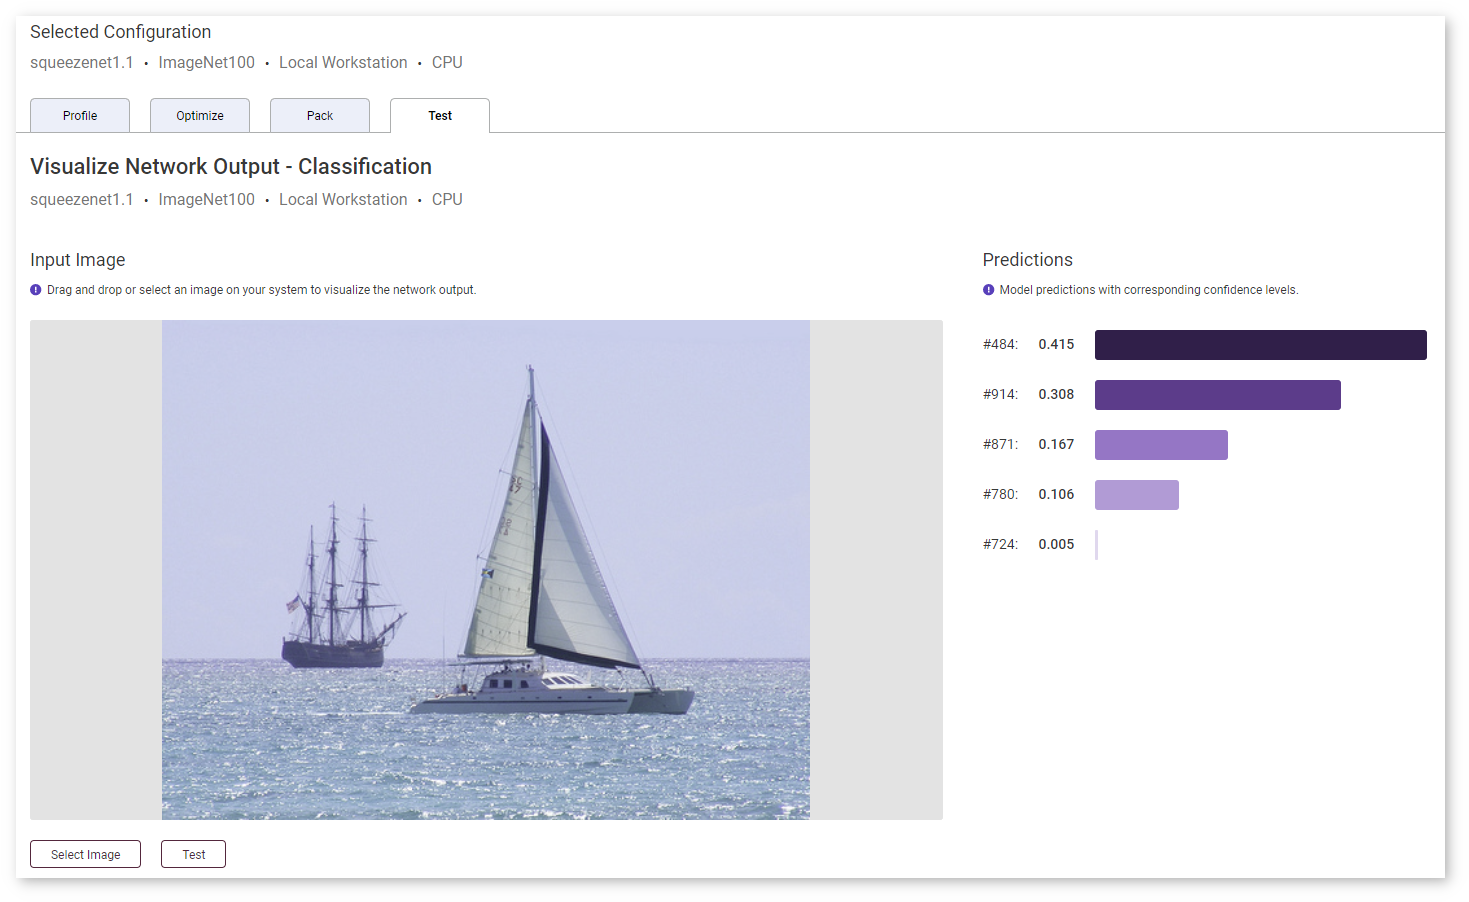
Predictions for a classification model with corresponding confidence levels are sorted from the highest confidence rate to the lowest.
With object-detection models, you can visualize bounding boxes by hovering your mouse over a class prediction on the right. 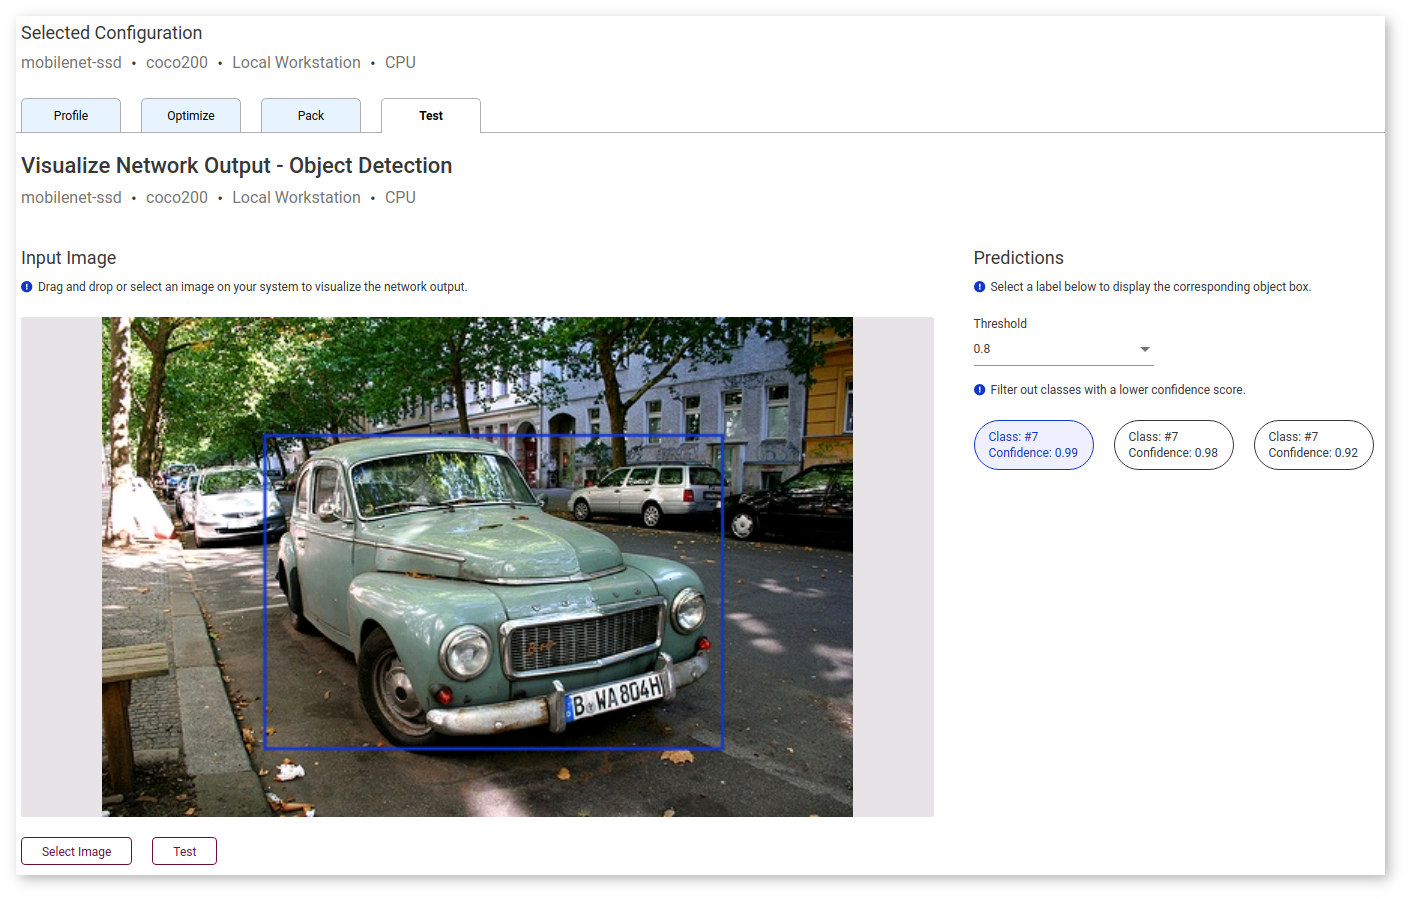
Use the Threshold drop-down list to filter classes based on the confidence score.
With instance-segmentation models, you can visualize masks by hovering your mouse over a class prediction on the right. 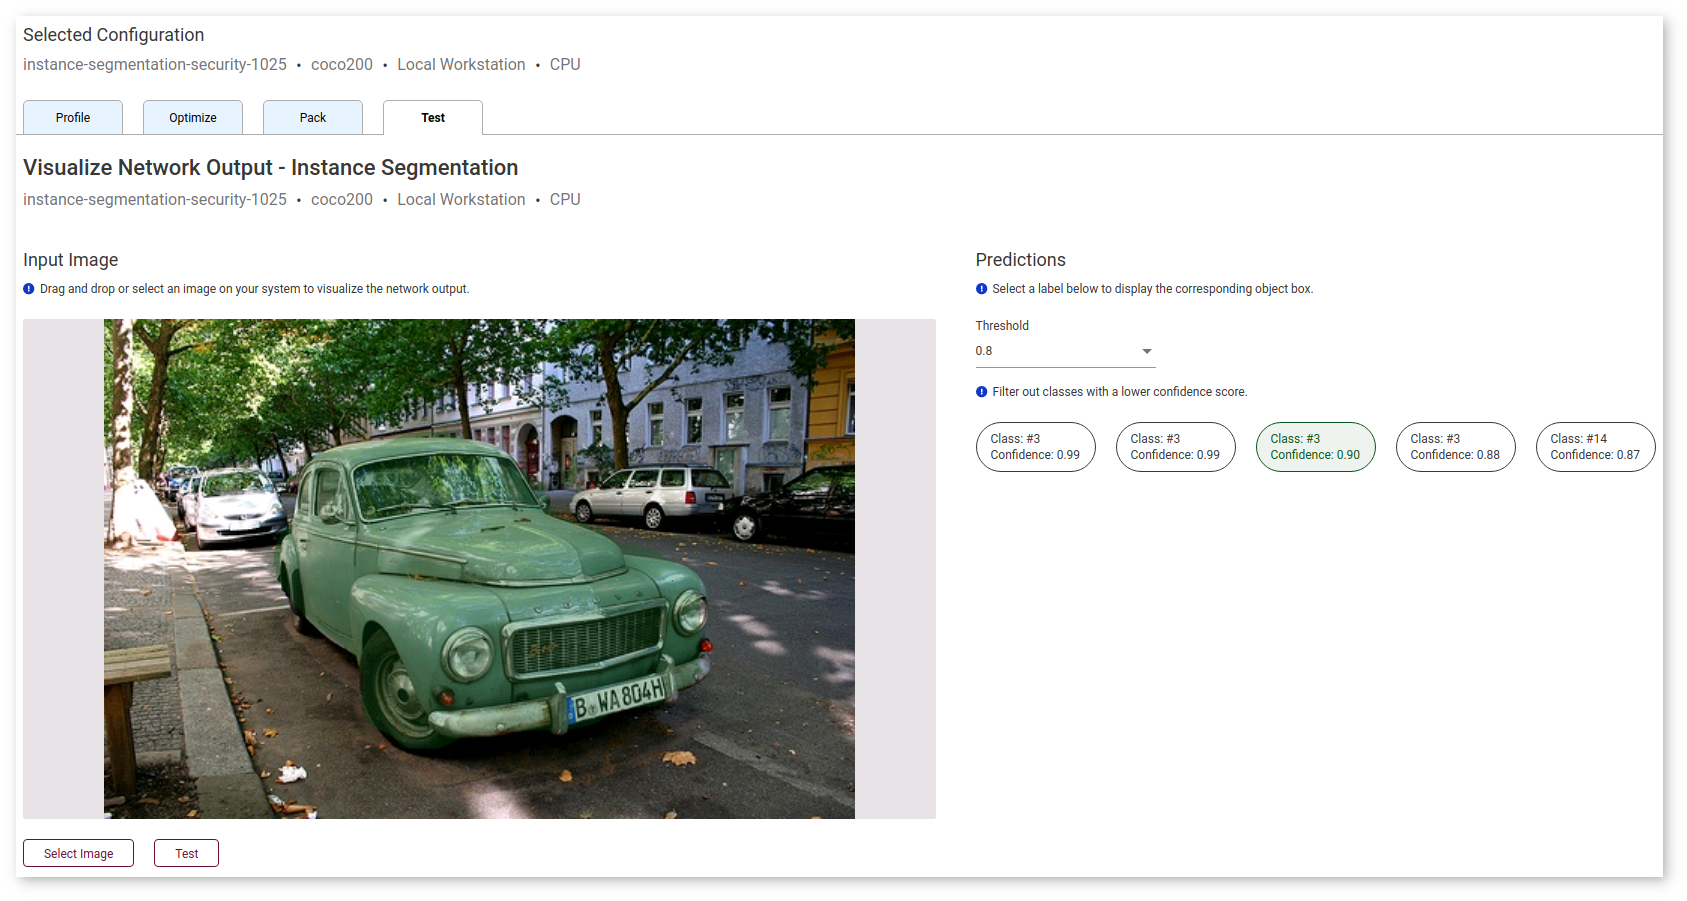
Use the Threshold drop-down list to filter classes based on the confidence score.
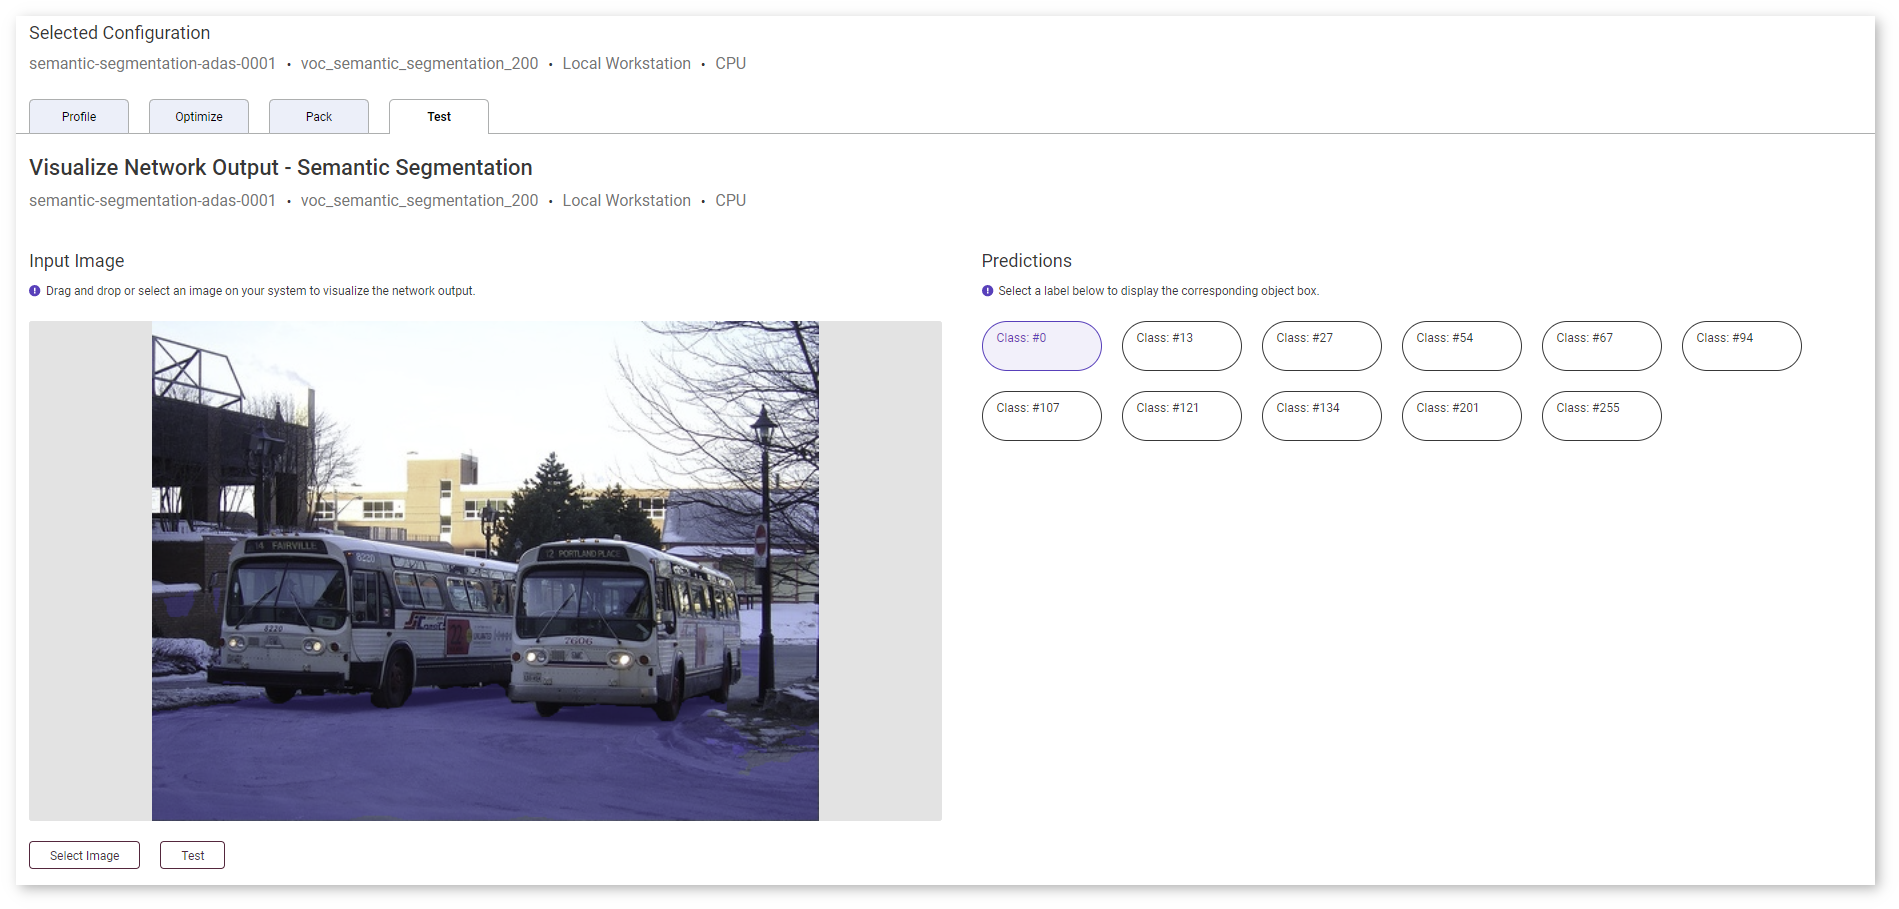
For semantic-segmentation models, the DL Workbench provides areas of categorized objects, which enables you to see whether your model recognized all object types, like the buses in this image: 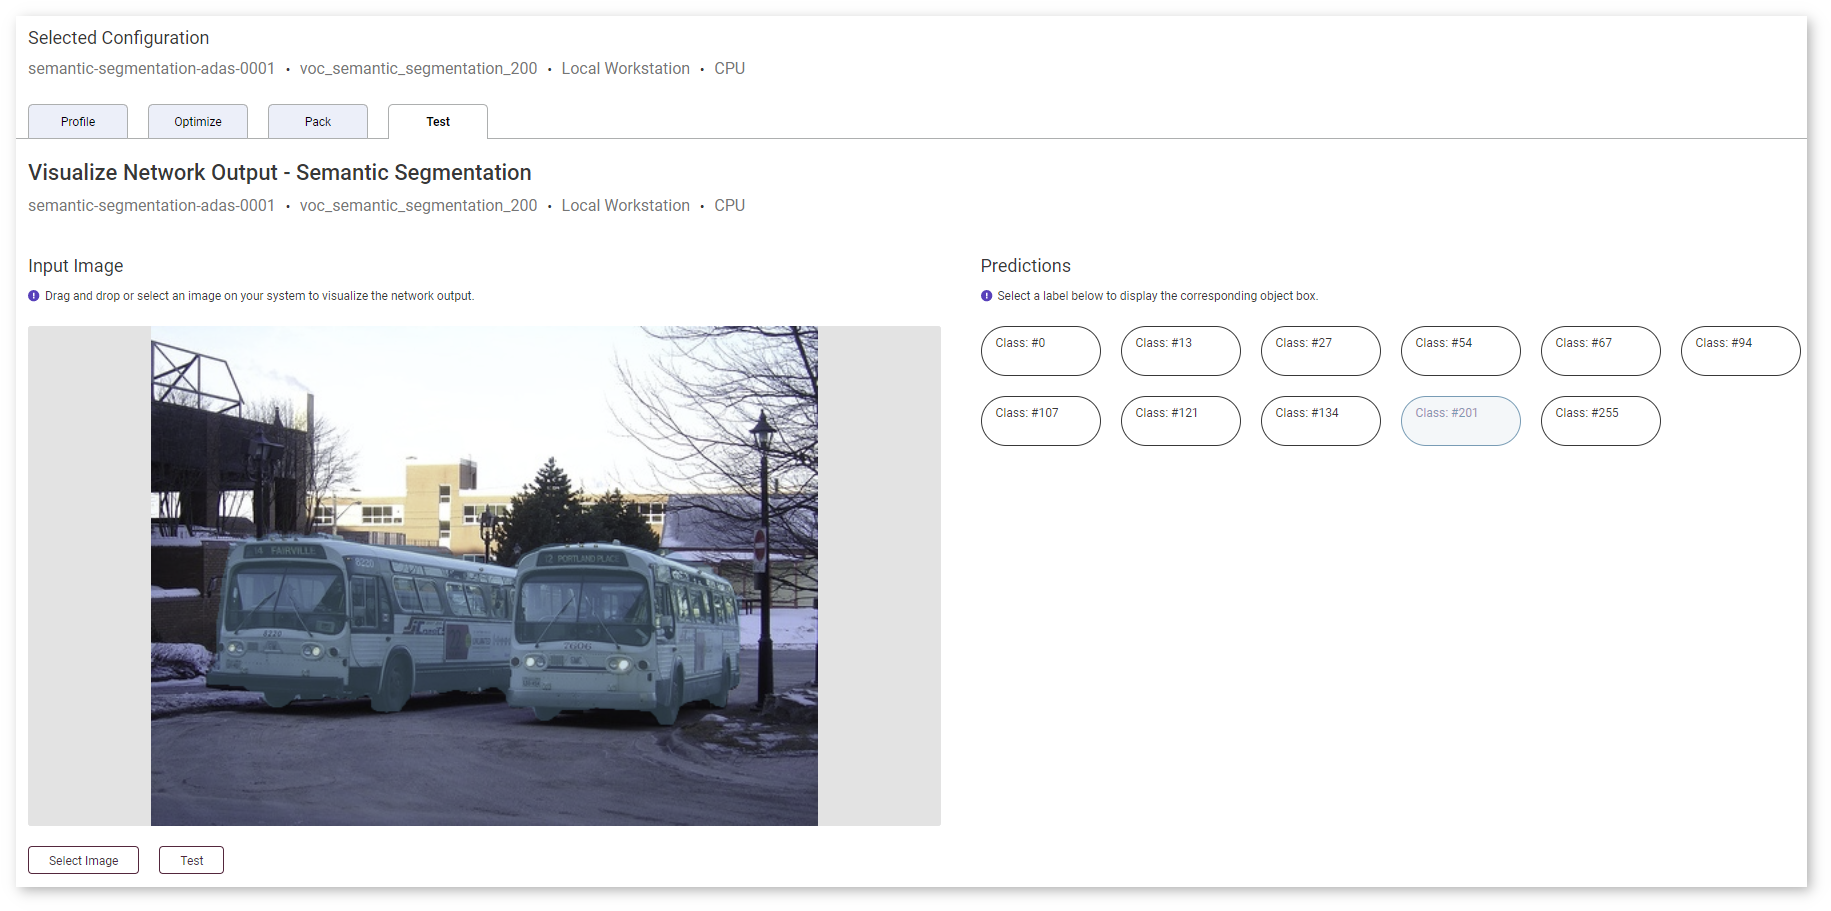
Or the road in the same image: