You can compare performance between two versions of a model; for example, between an original FP32 model and an optimized INT8 model. Once the optimization procedure is complete, click Compare under the Configurations Table: 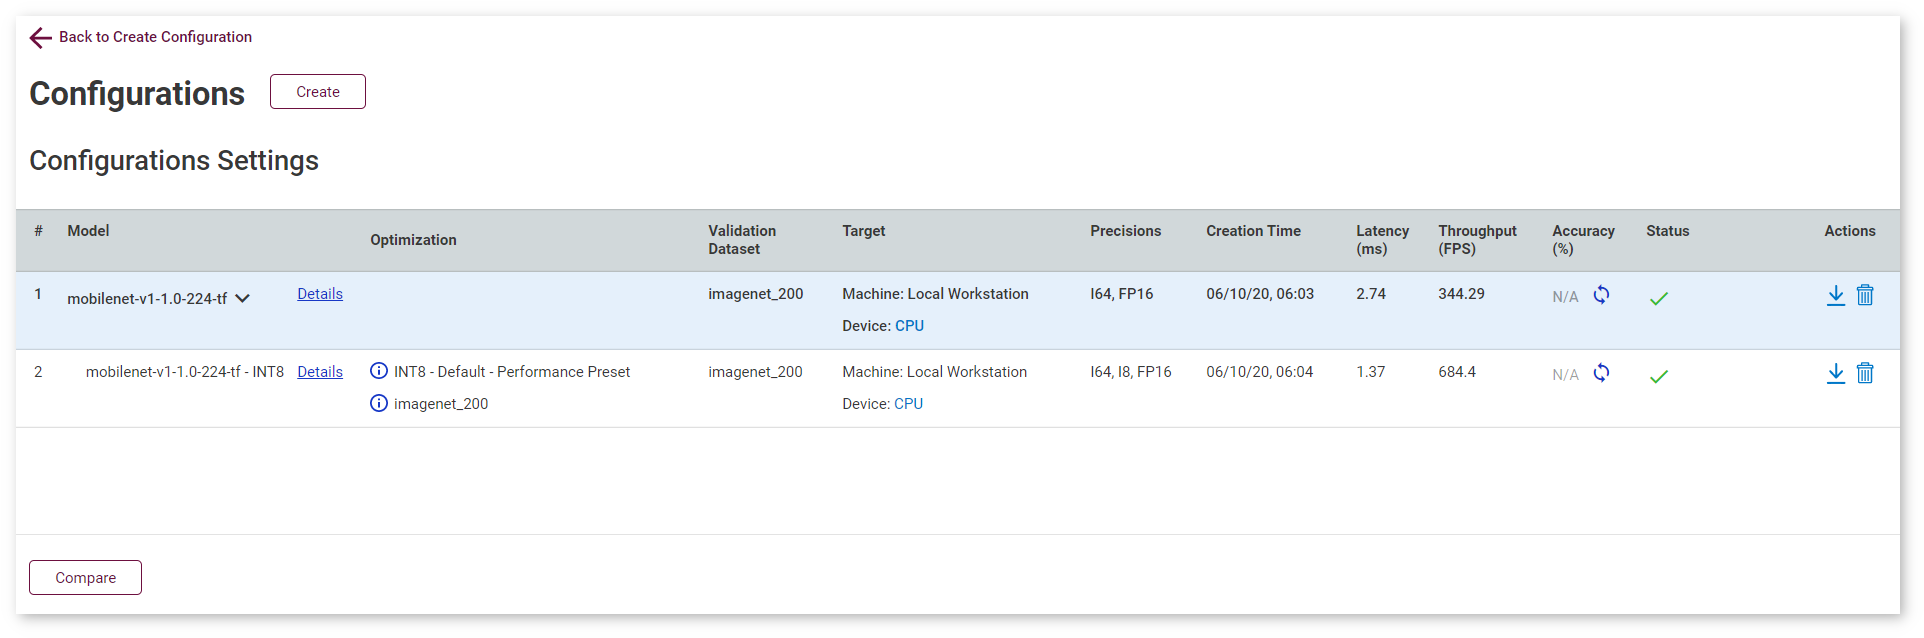
The Compare Inferences within Model page appears: 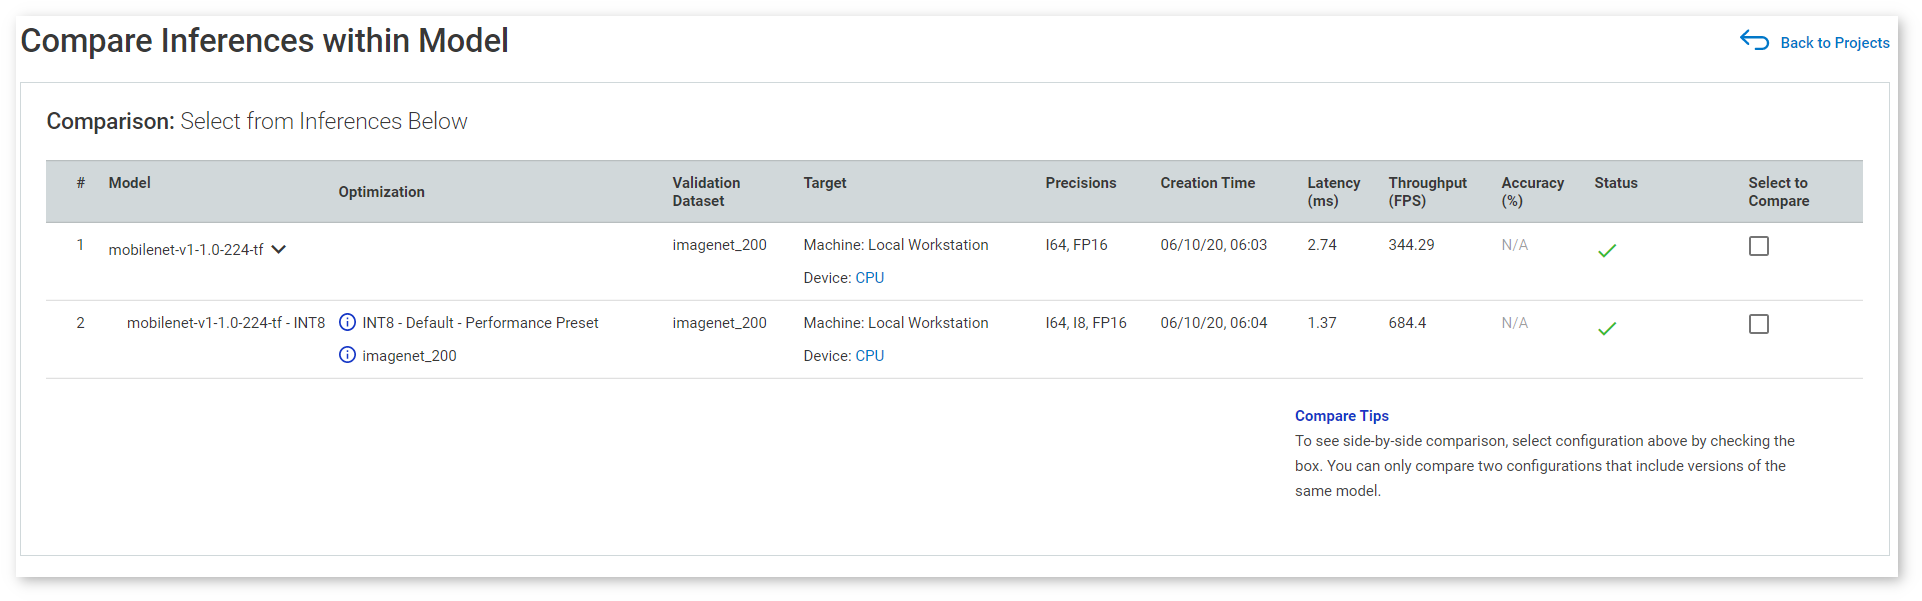
NOTE: To leave the Compare Inferences page, click Back to Projects on the right of the page title.
Select model versions to compare by checking the relevant rows: 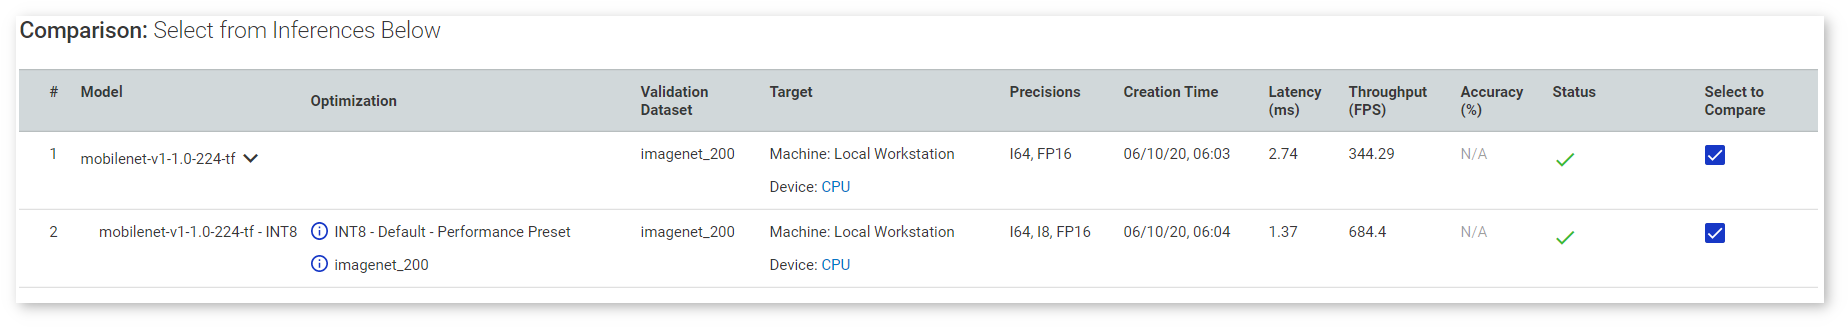
TIP: Uncheck a row to deselect the corresponding inference.
As you select a version, the Inference Results graph appears. The graph instantly adjusts to your selection of versions by adding and removing corresponding points. Point A stands for the first selected inference, point B represents the second one: 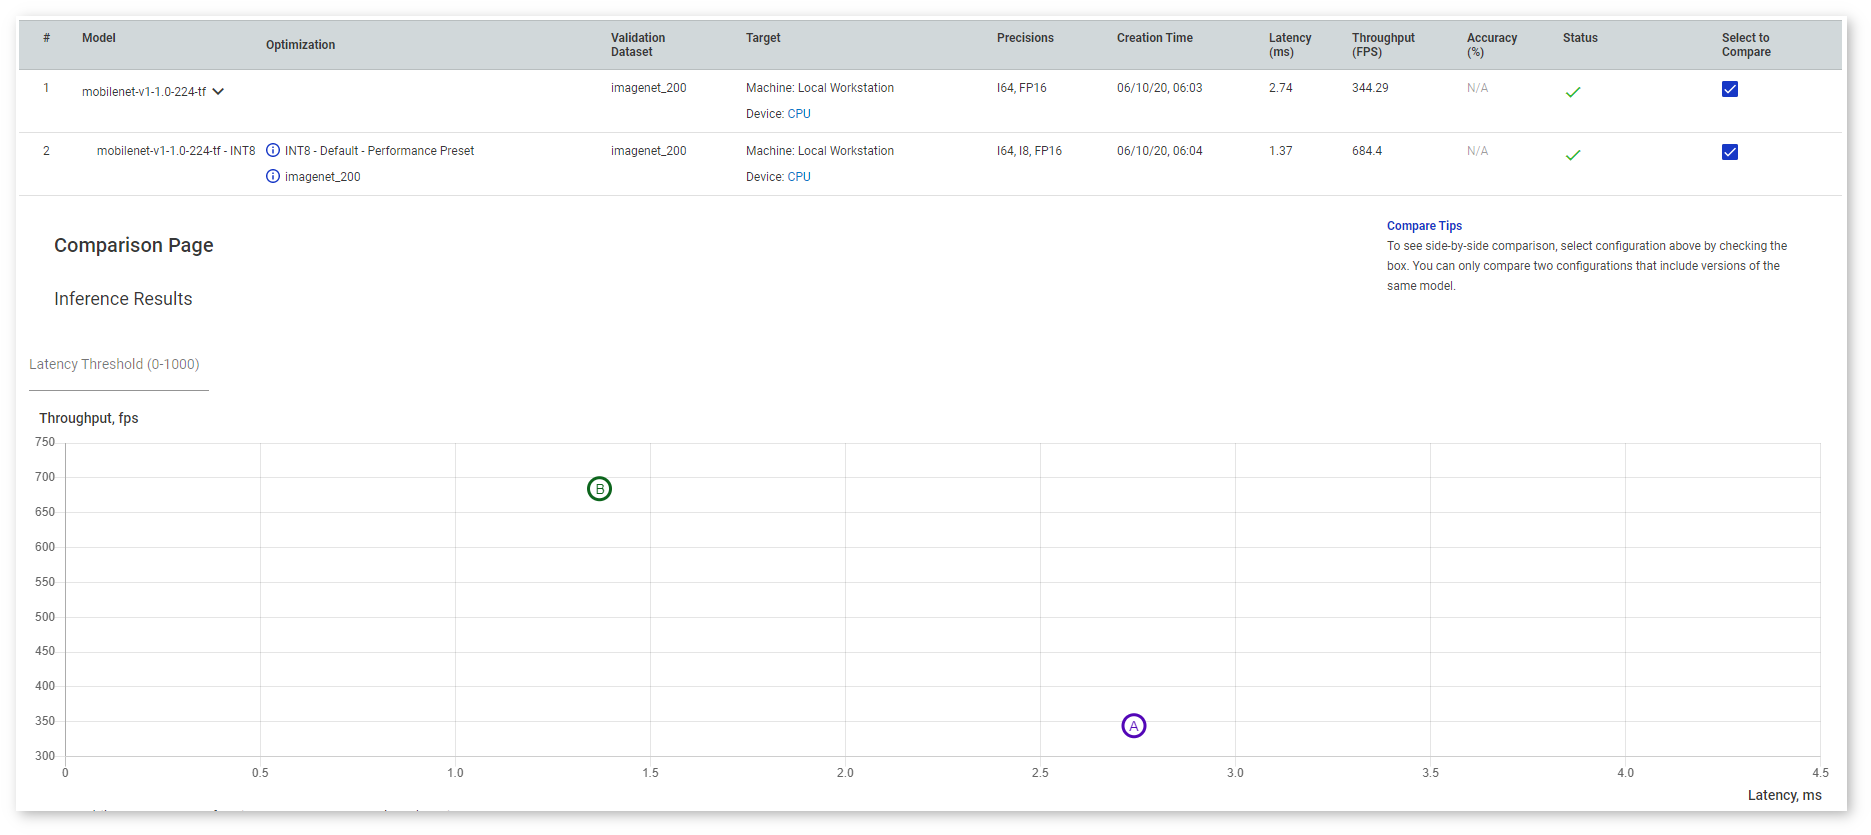
NOTE: Each point is associated with a special color used in all visualizations corresponding to it.
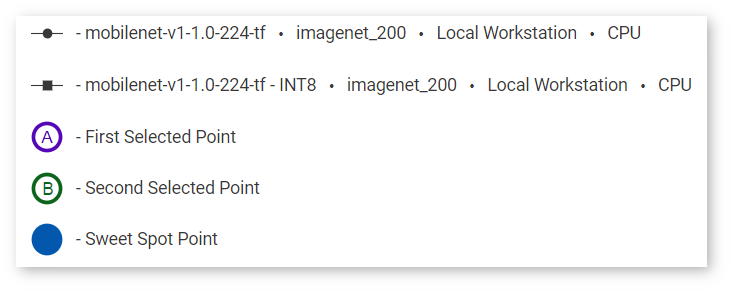
Right under the Inference Results graph, find the graph legend:
In the Latency Threshold box, specify the maximum latency value to find the optimal configuration with the best throughput. The point representing the sweet spot becomes a blue filled circle: 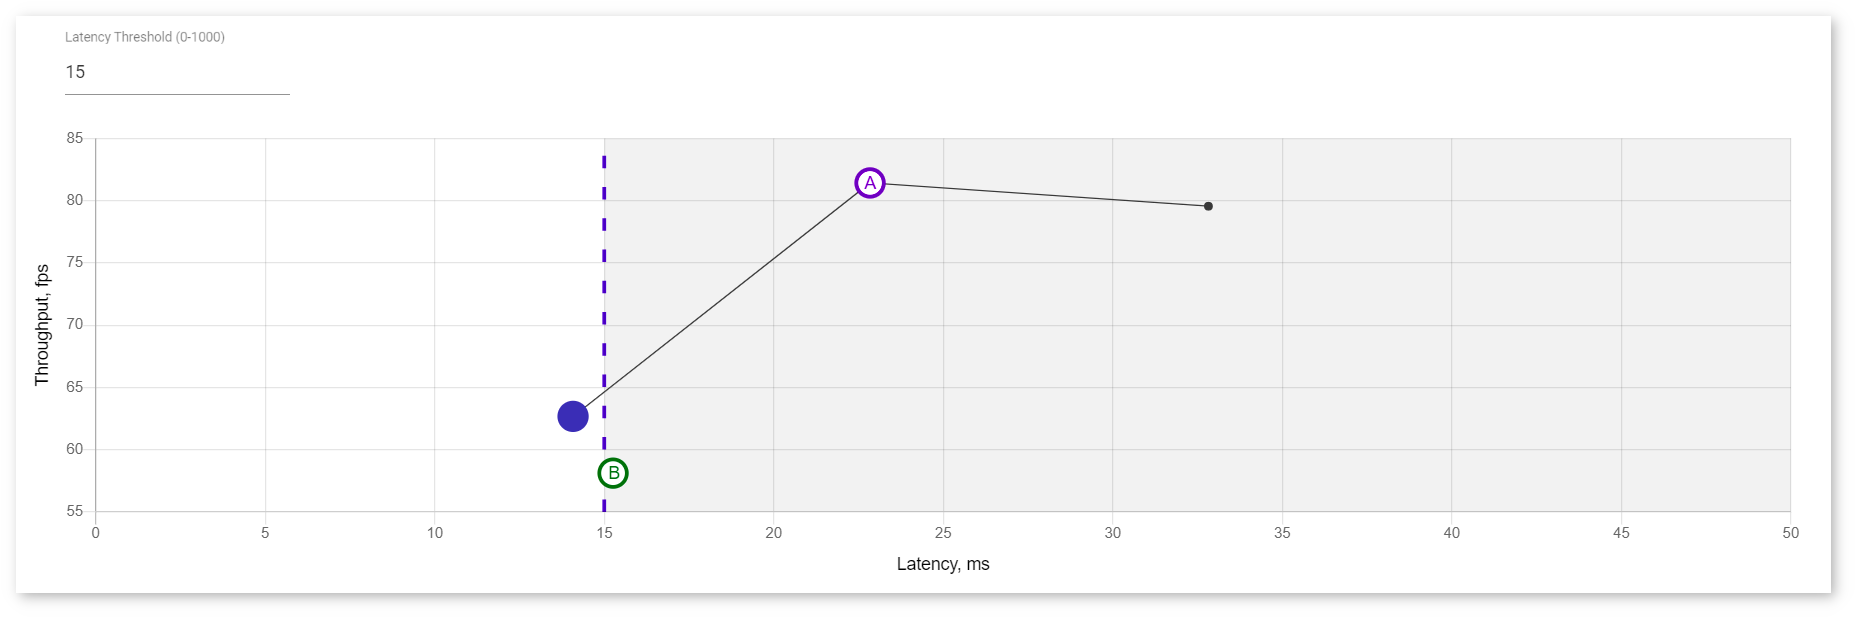
If one of the two compared points happens to be a sweet spot, it turns blue while the letter is still indicated: 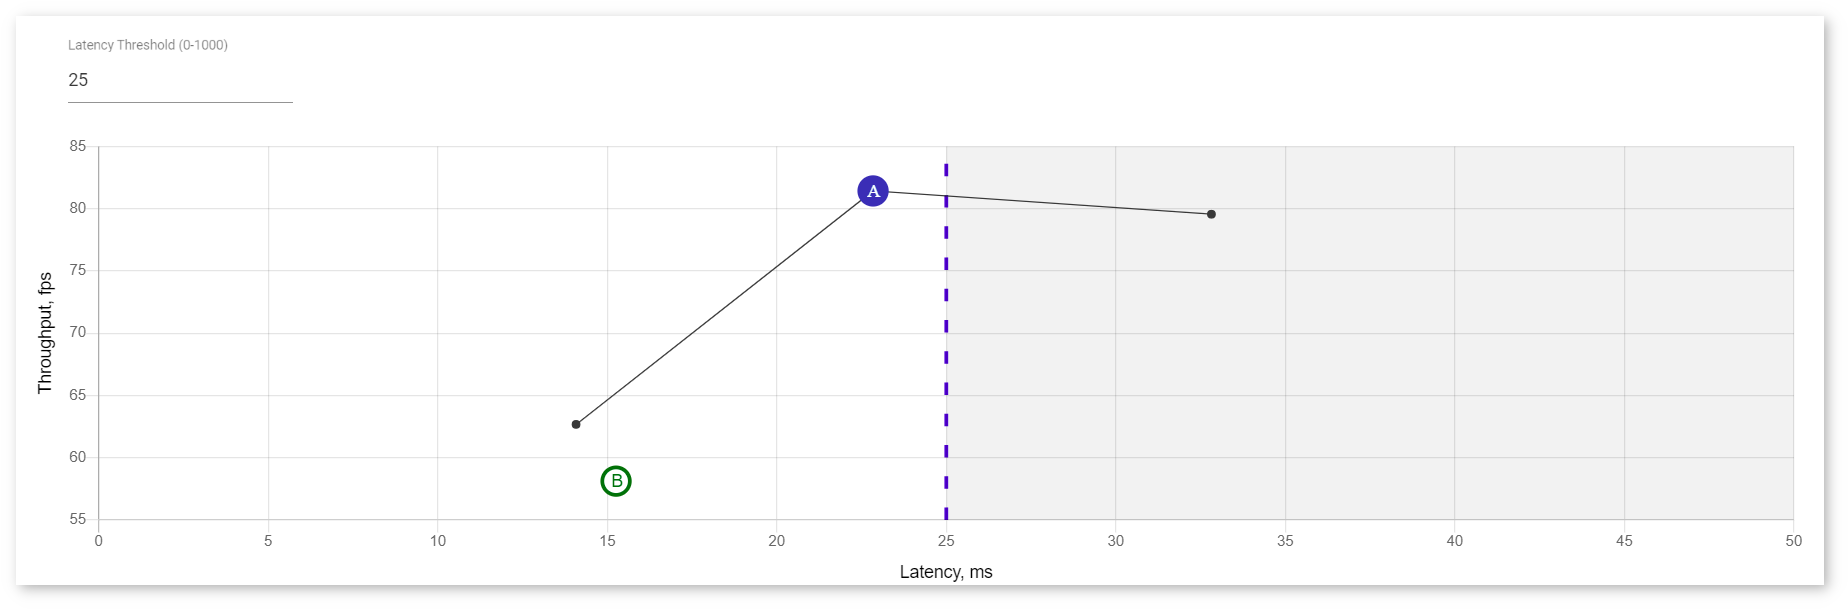
Scroll down to the Model Performance Summary section. It includes graphs showing the mean inference time and donut charts representing execution time by layer for both versions. 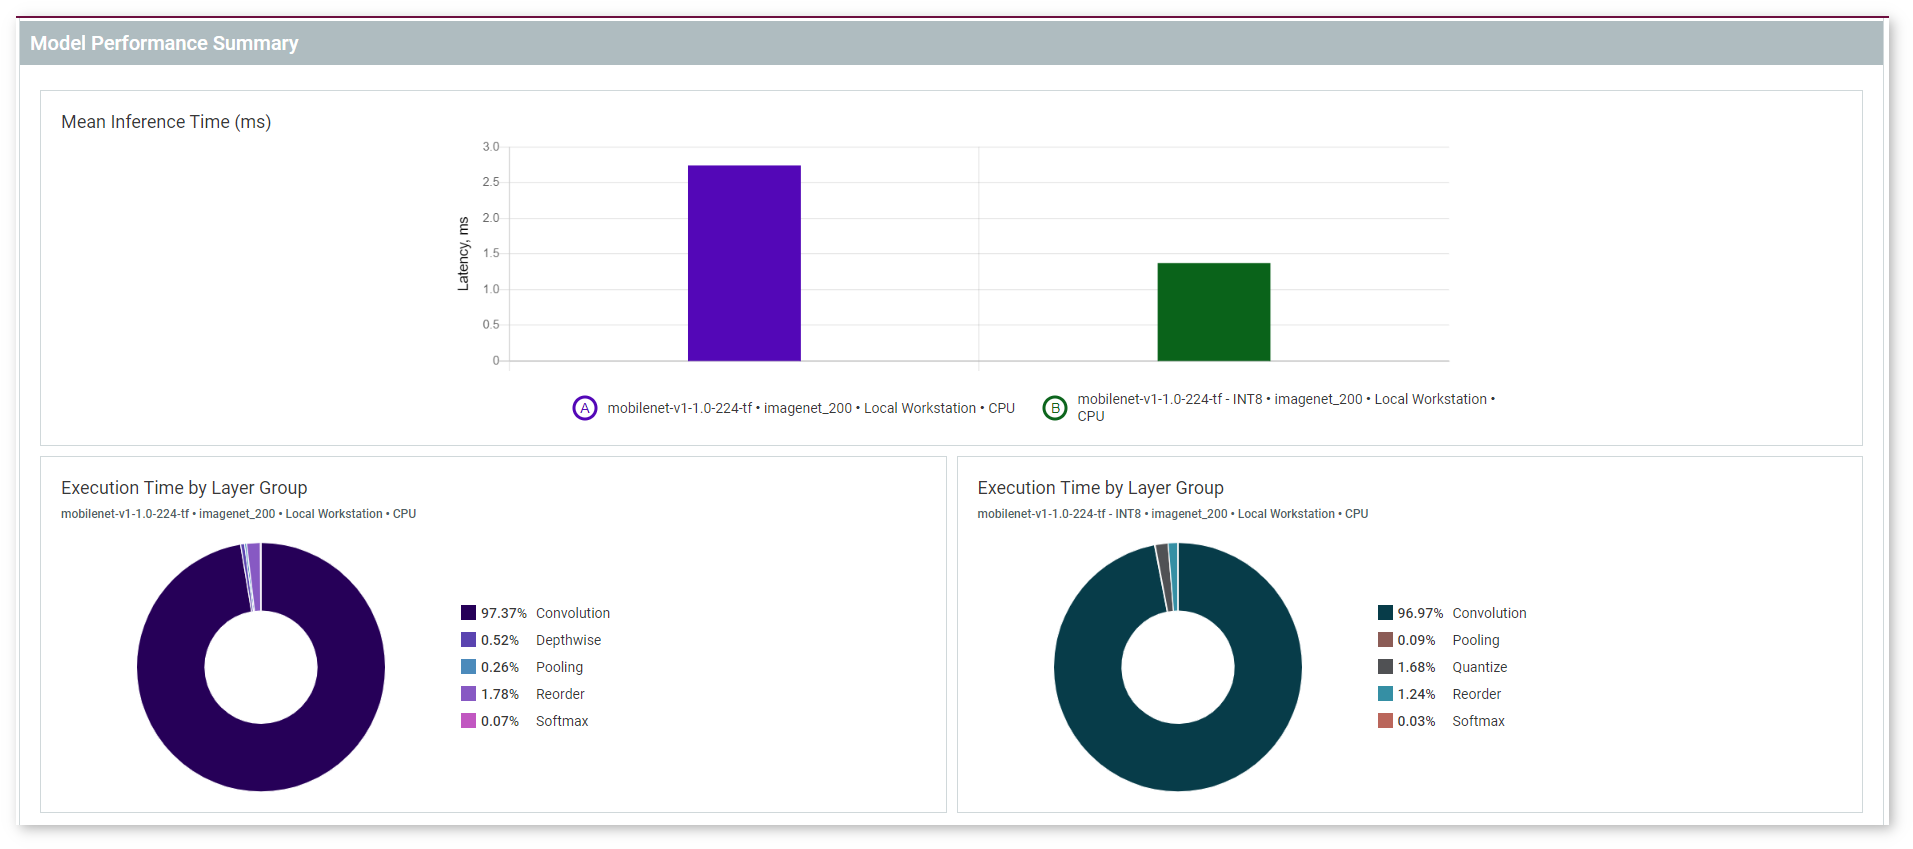
The Layers Table show all layers of both versions of a model.For details on reading the table, see the Per-Layer Comparison section of the Visualize Model page.
