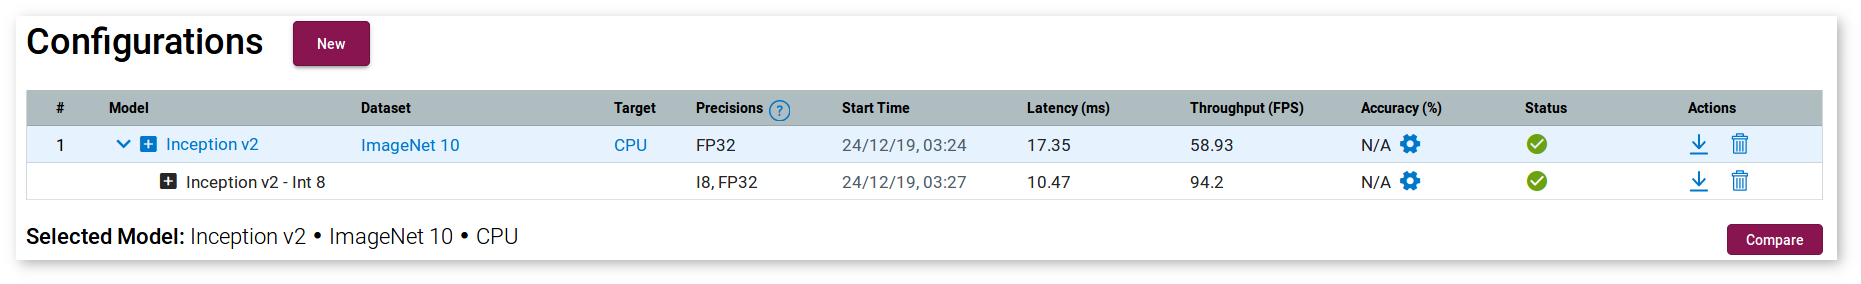
You can compare performance between two versions of a model; for example, between an FP32 model and an optimized INT8 model. Once an optimization procedure is complete, click the Compare button on the Projects page:
The Compare Inferences within Model page appears:
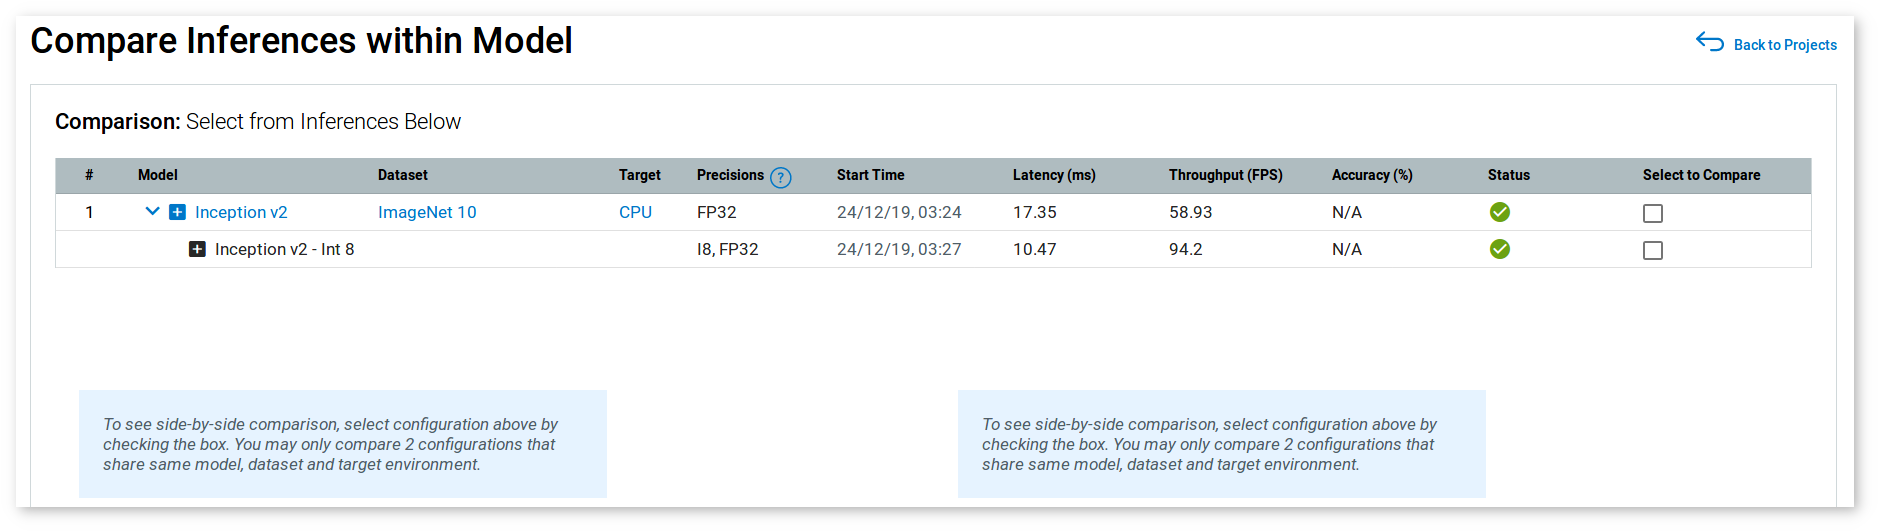
NOTE: To leave the Compare Inferences page, use the Back to Projects button to the right of the page title.
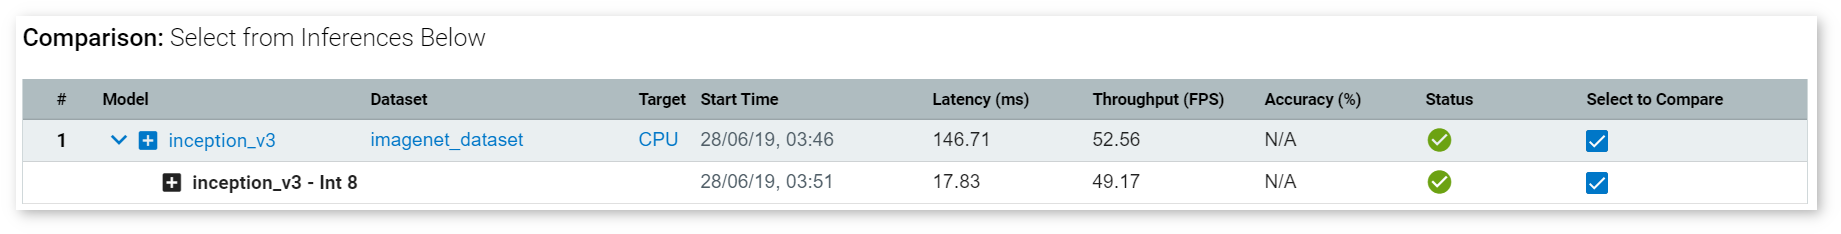
Select models to compare by checking the relevant rows:
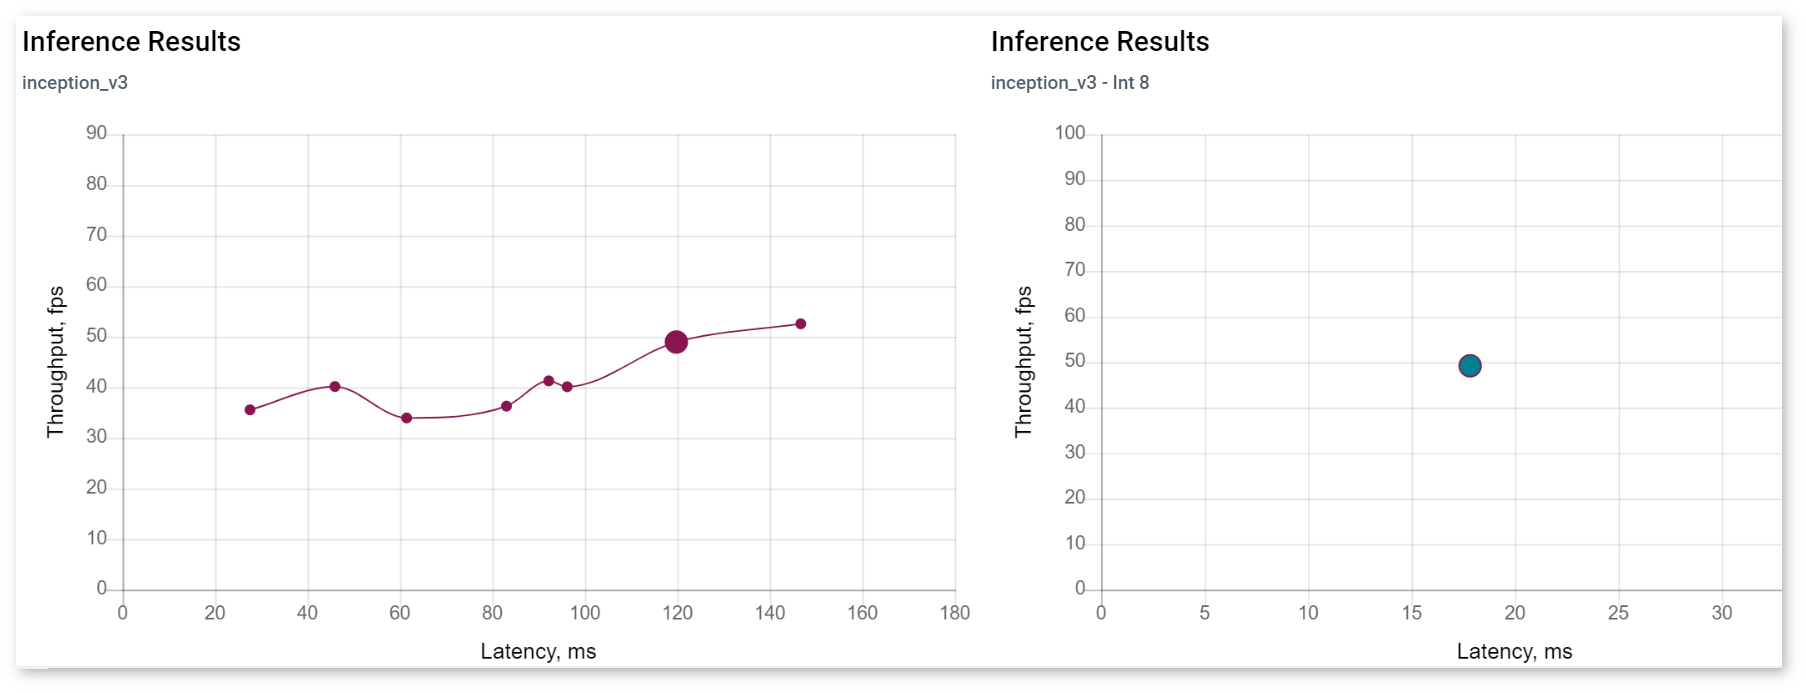
Graphs with inference results for the selected versions appear (the version names are indicated):
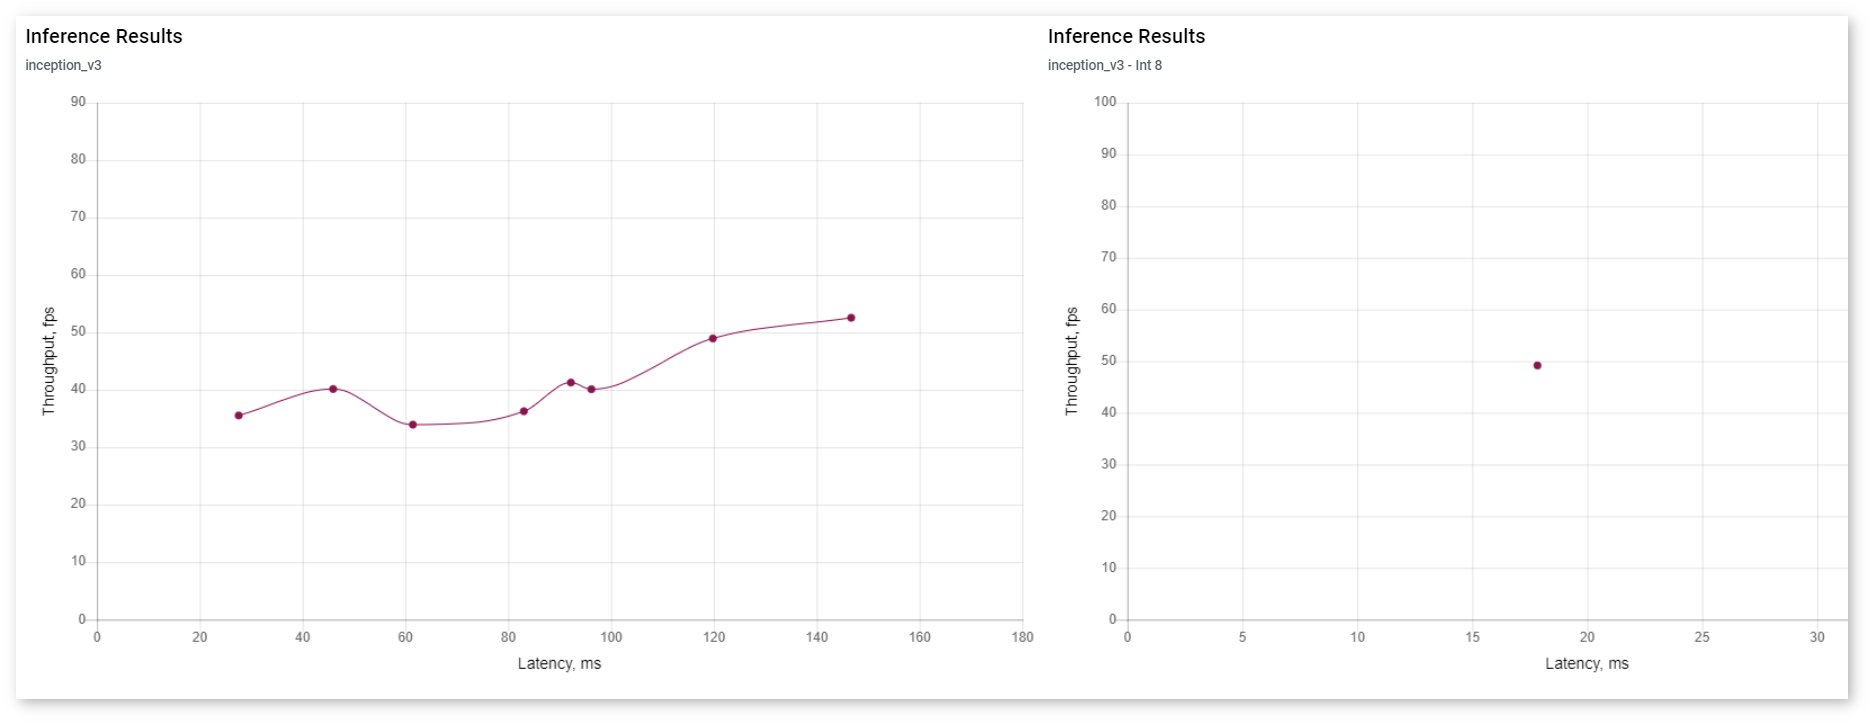
Click any two points on the graphs to view performance details corresponding to them.
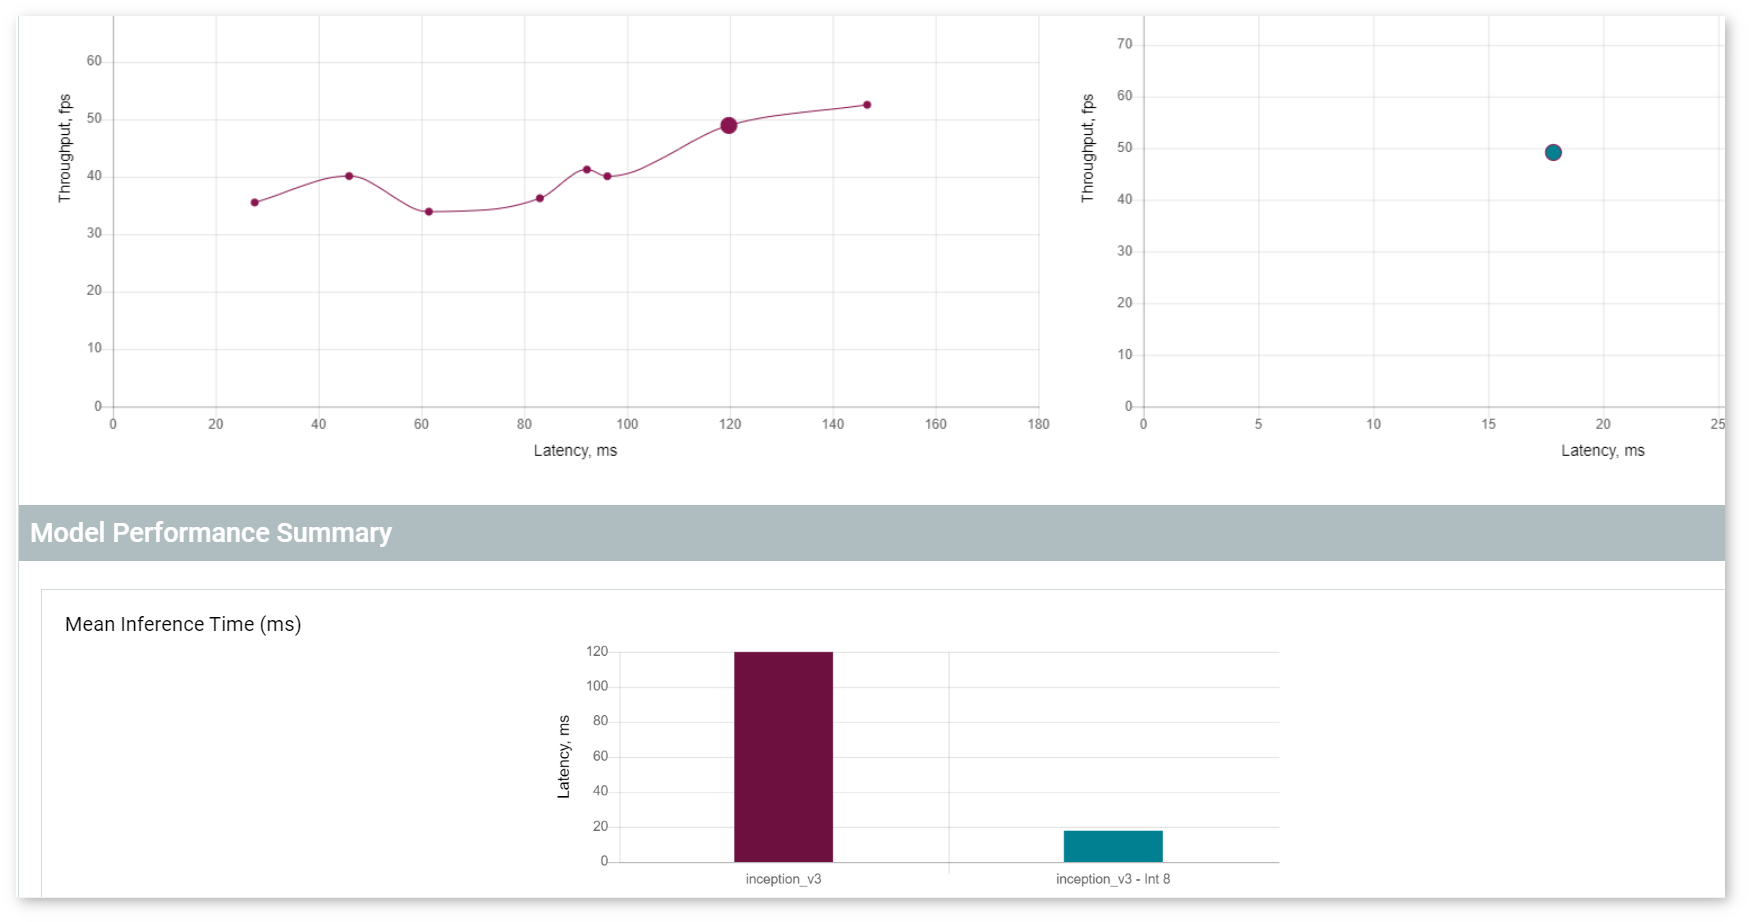
When you click individual points in the graph, the Model Performance Summary section appears. It includes graphs showing the mean inference time and pie charts representing execution time by layer for both versions.
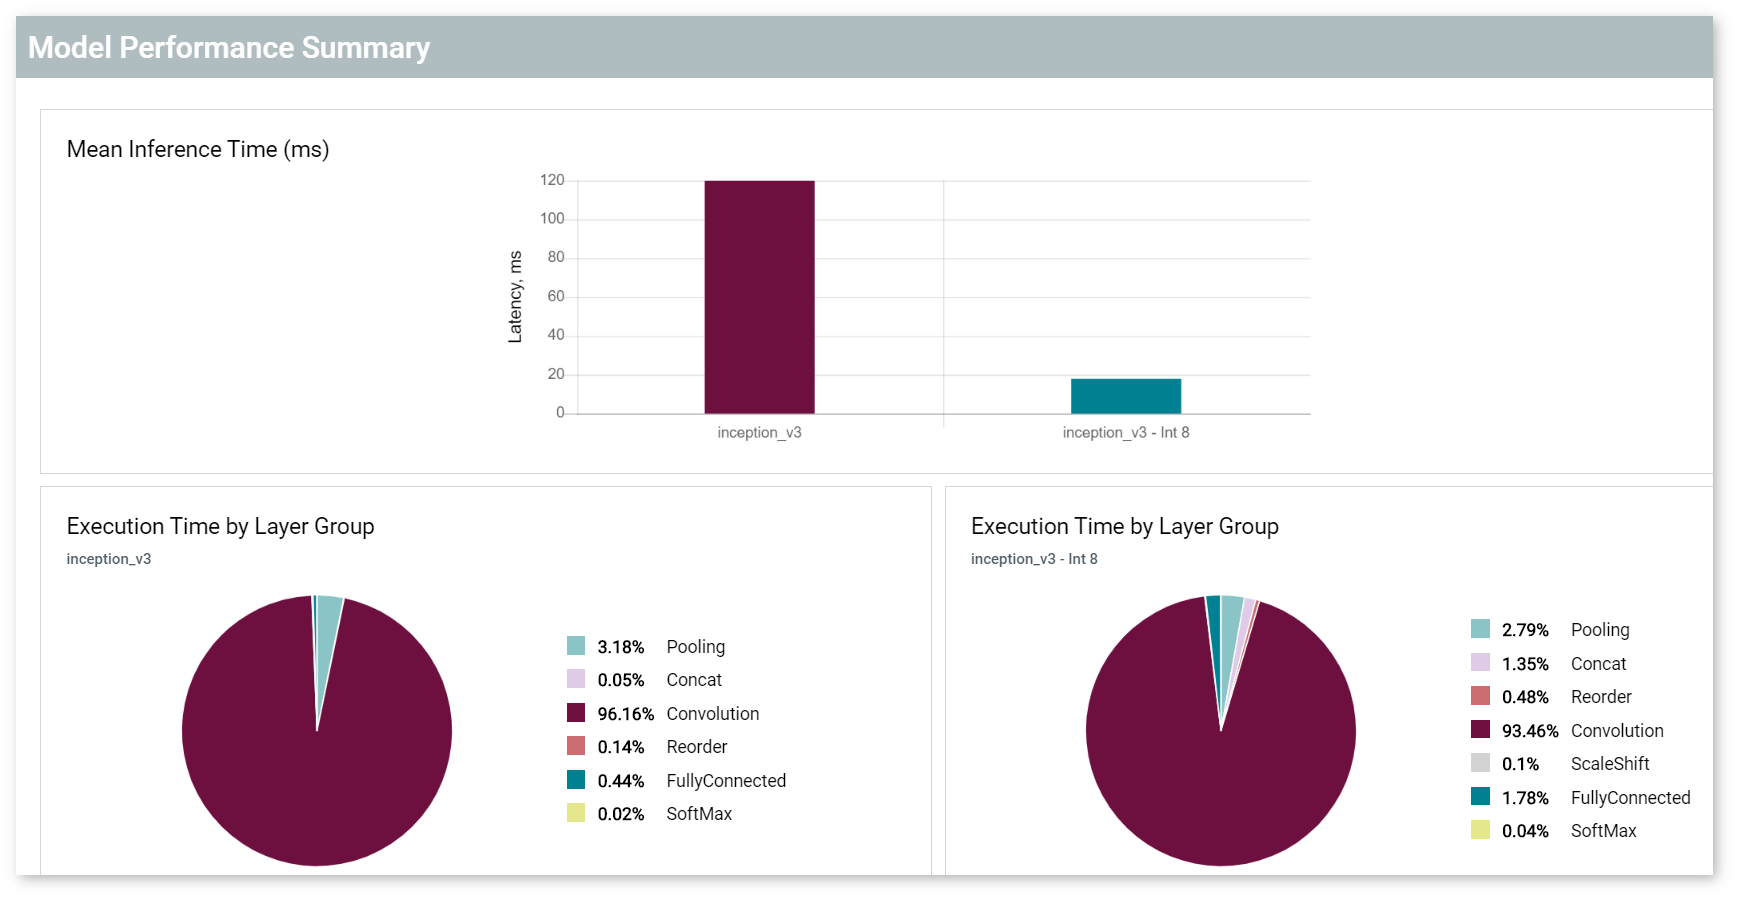
The color of a bar on the graphs corresponds to the color of a selected point:
TIP: Click a point again to deselect an inference.
For details on reading the Layer table for the different versions of a model, see the Per-Layer Comparison section of the Visualize Model page.