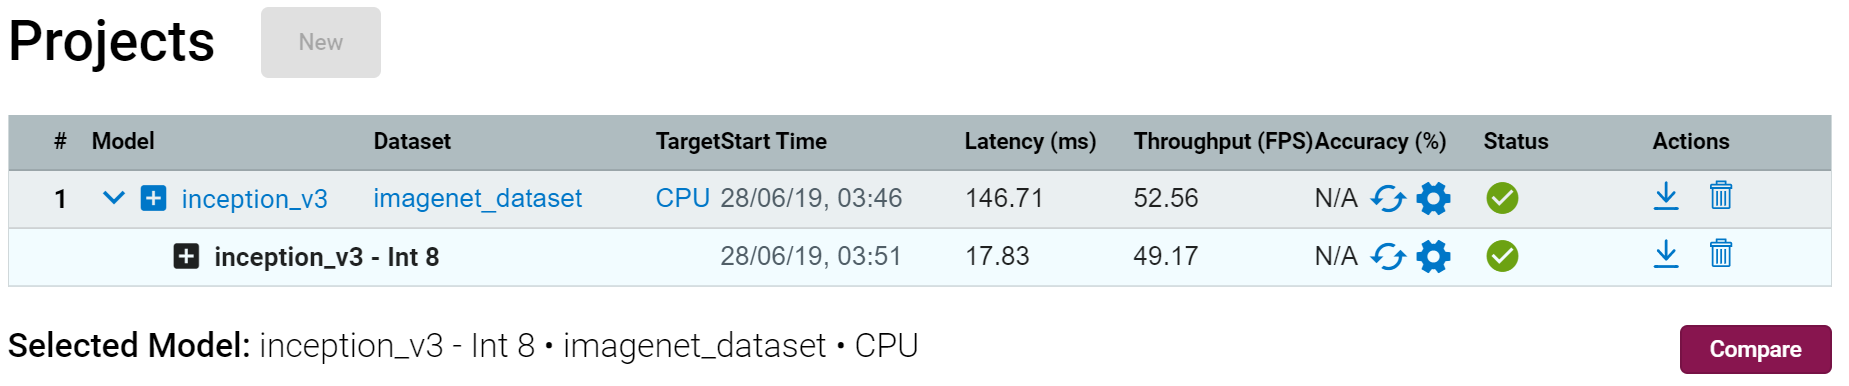
You can compare performance between two versions of models; for example, between an FP32 model and an optimized INT8 model. Once an optimization procedure is complete, click the Compare button on the Projects page:
The Compare Inferences within Model page appears:
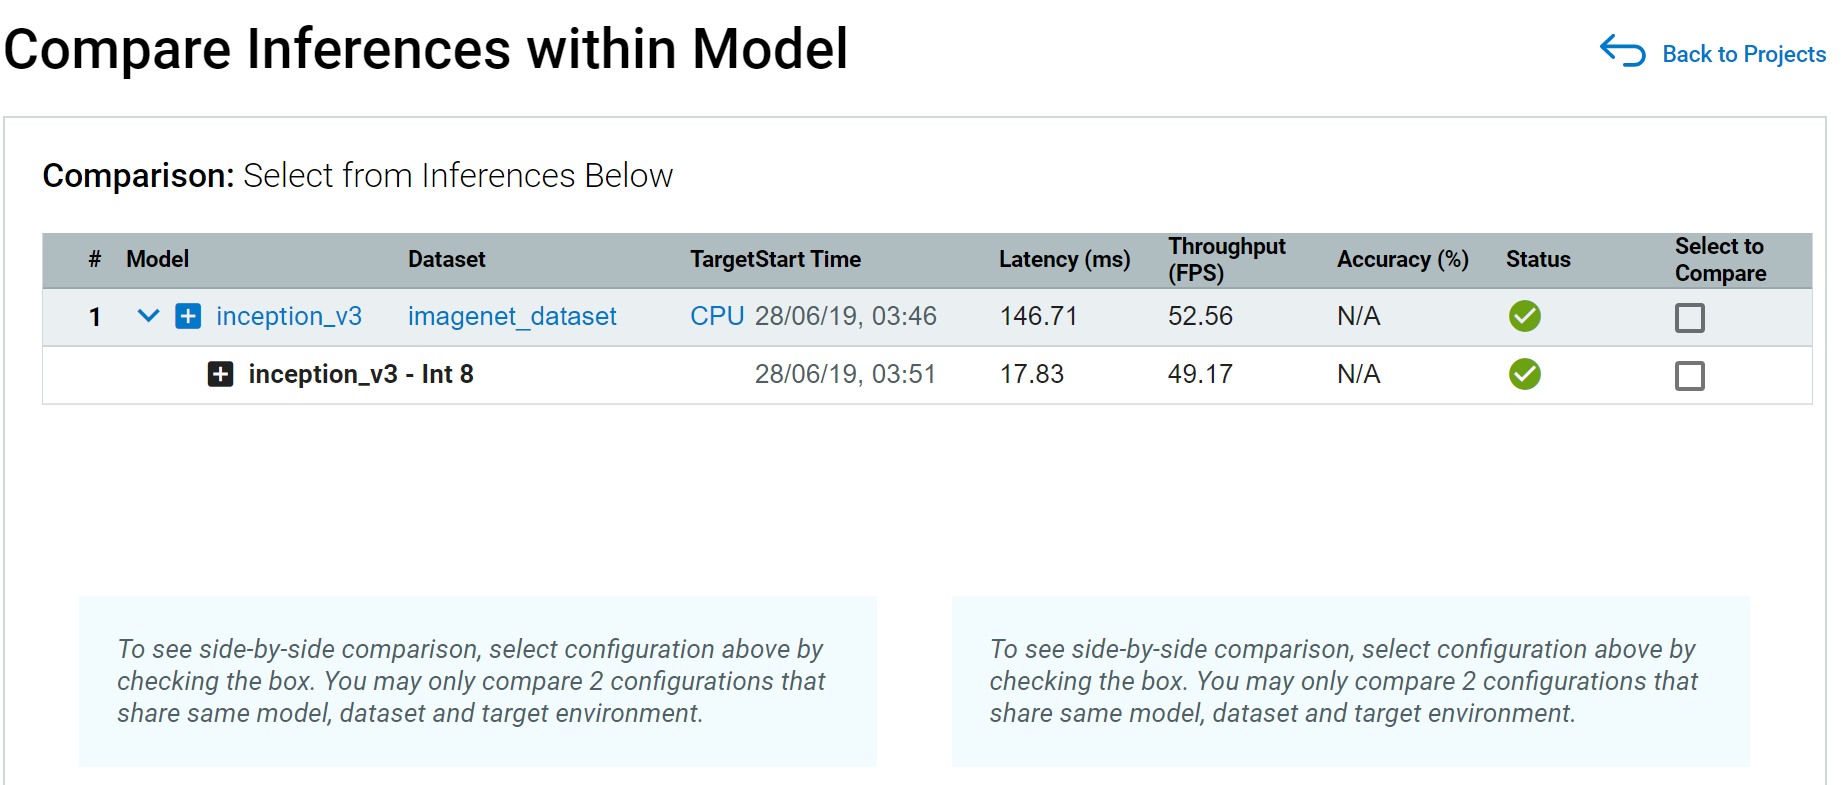
NOTE: To leave the Compare Inferences page, use the Back to Projects button to the right of the page name.
Select models to compare:
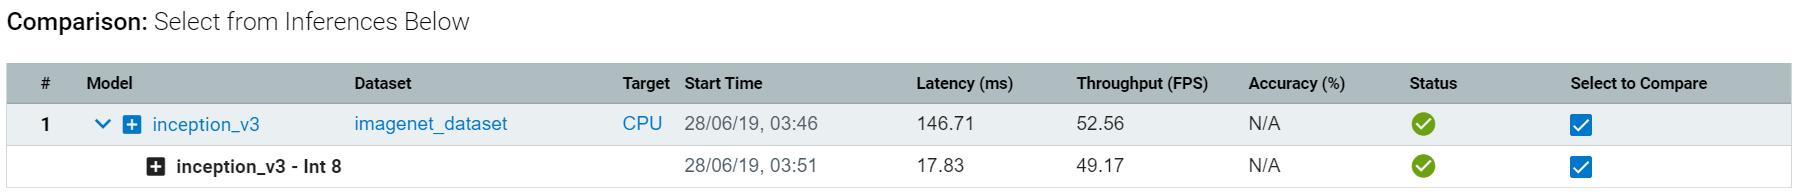
Graphs with inference results for the selected versions appear (the version names are indicated):
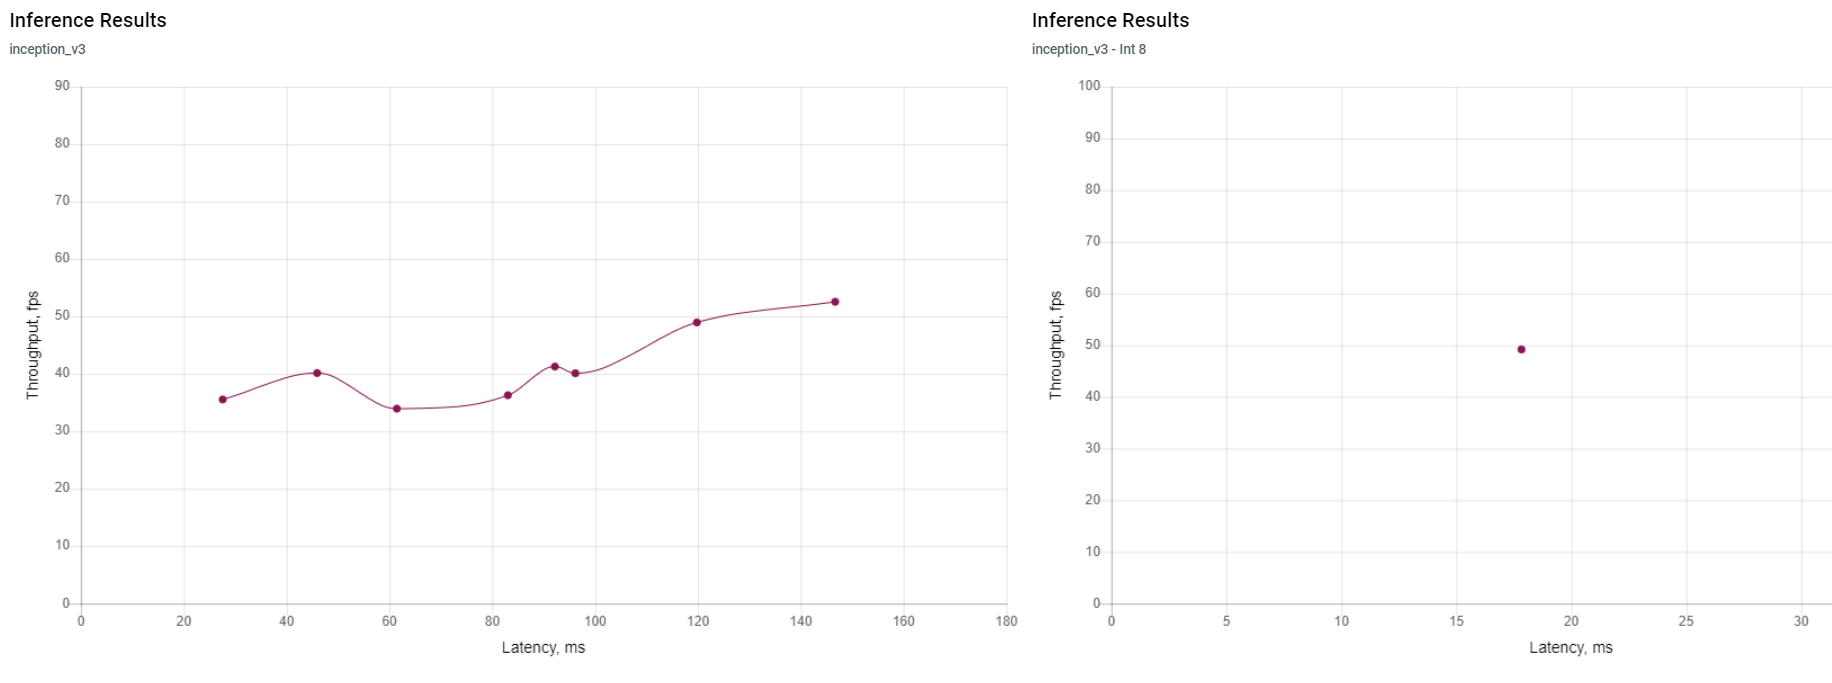
Click on any two points on the graphs to view performance details corresponding to them.
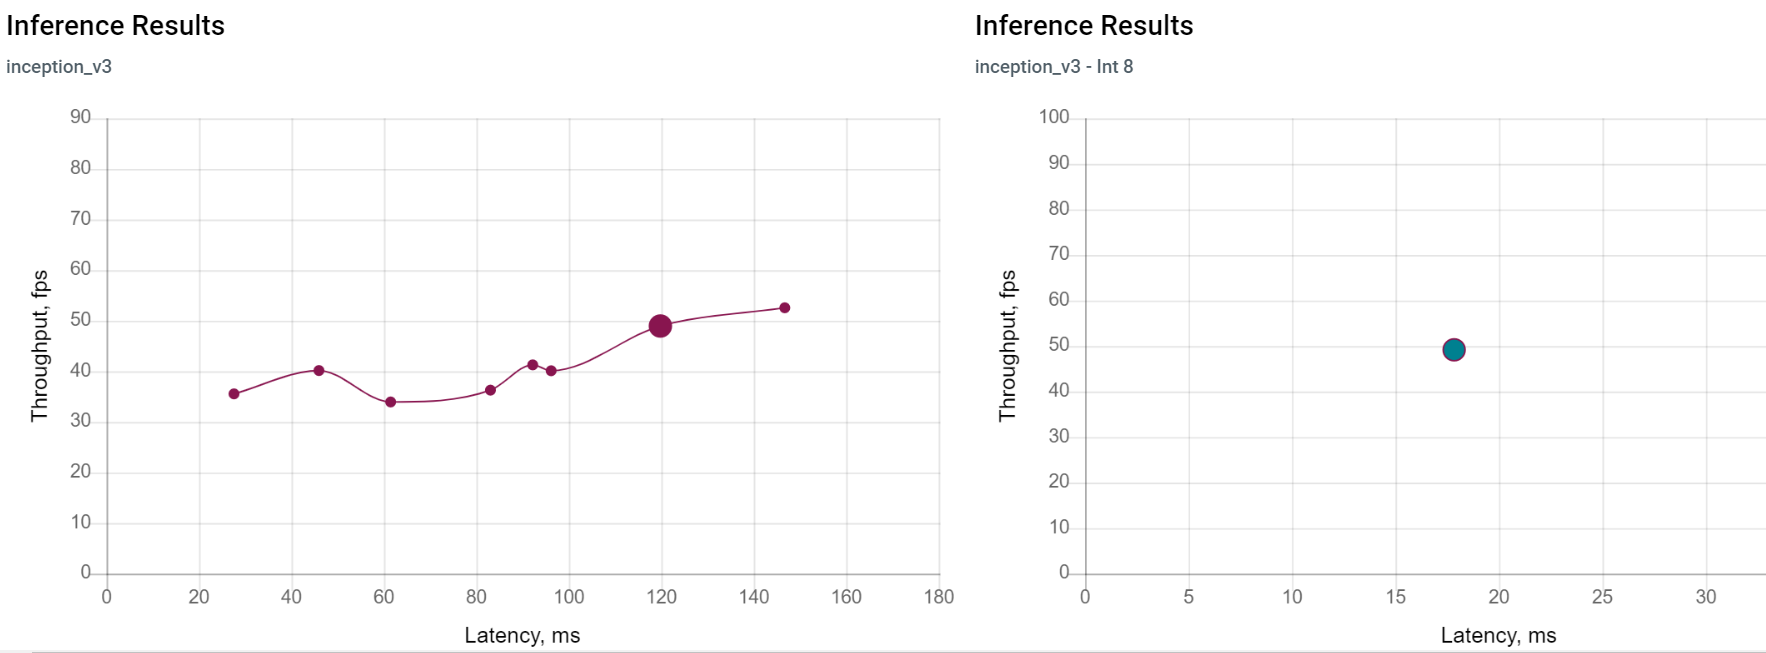
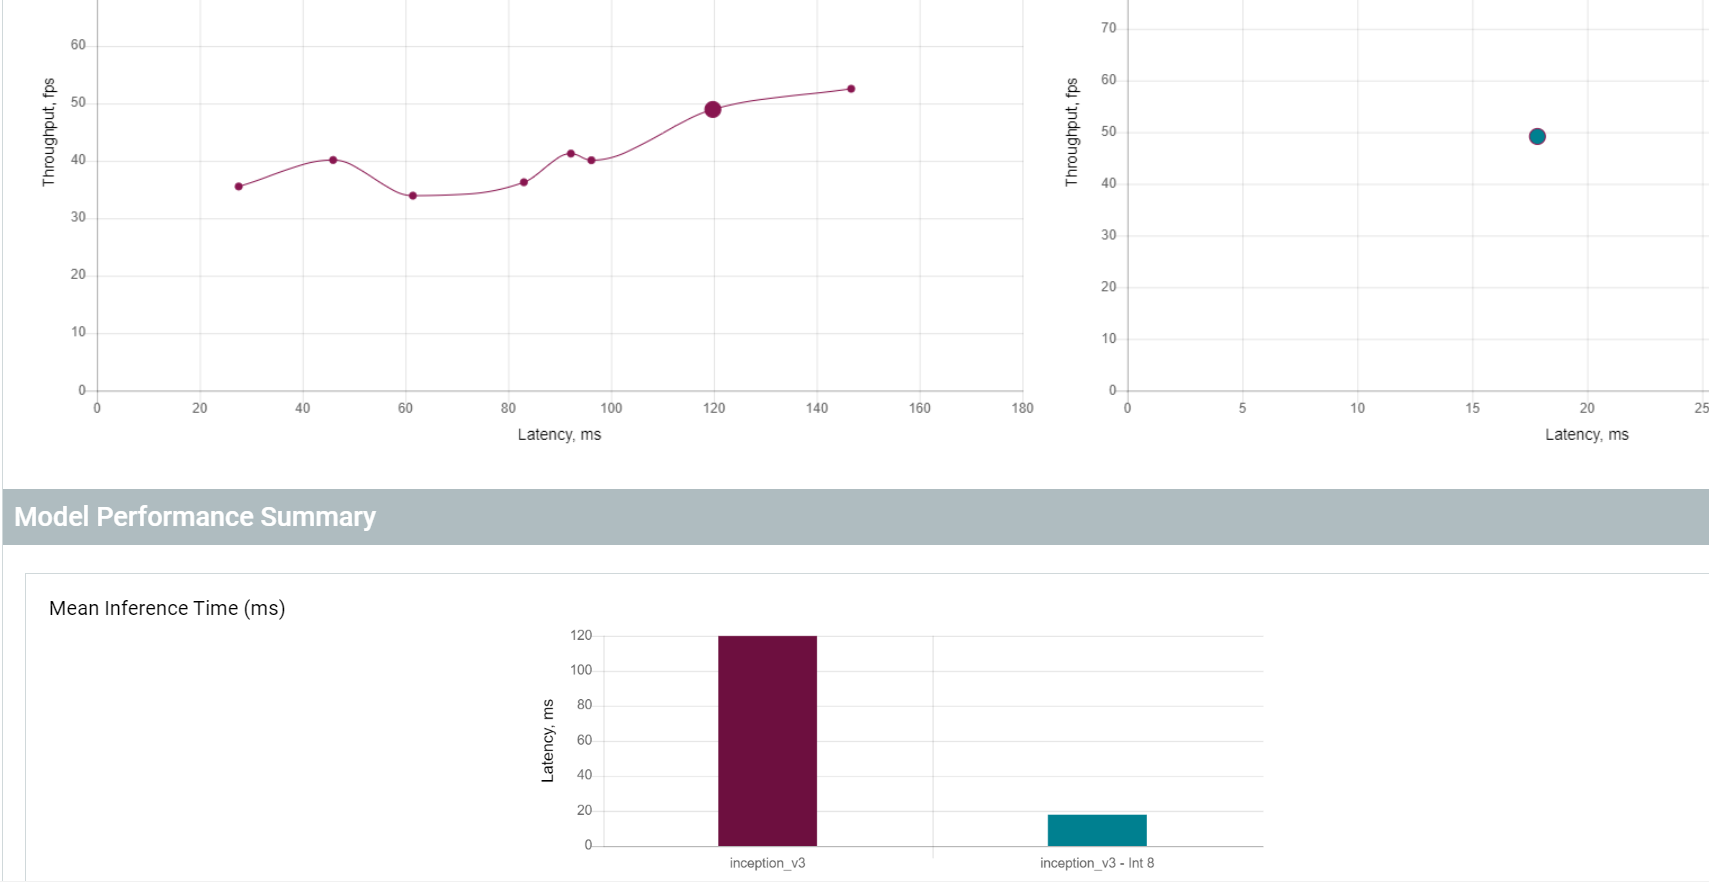
When you click on individual points in the graph, the Model Performance Summary section appears. It includes graphs showing mean inference time and pie charts representing execution time by layer for both versions.
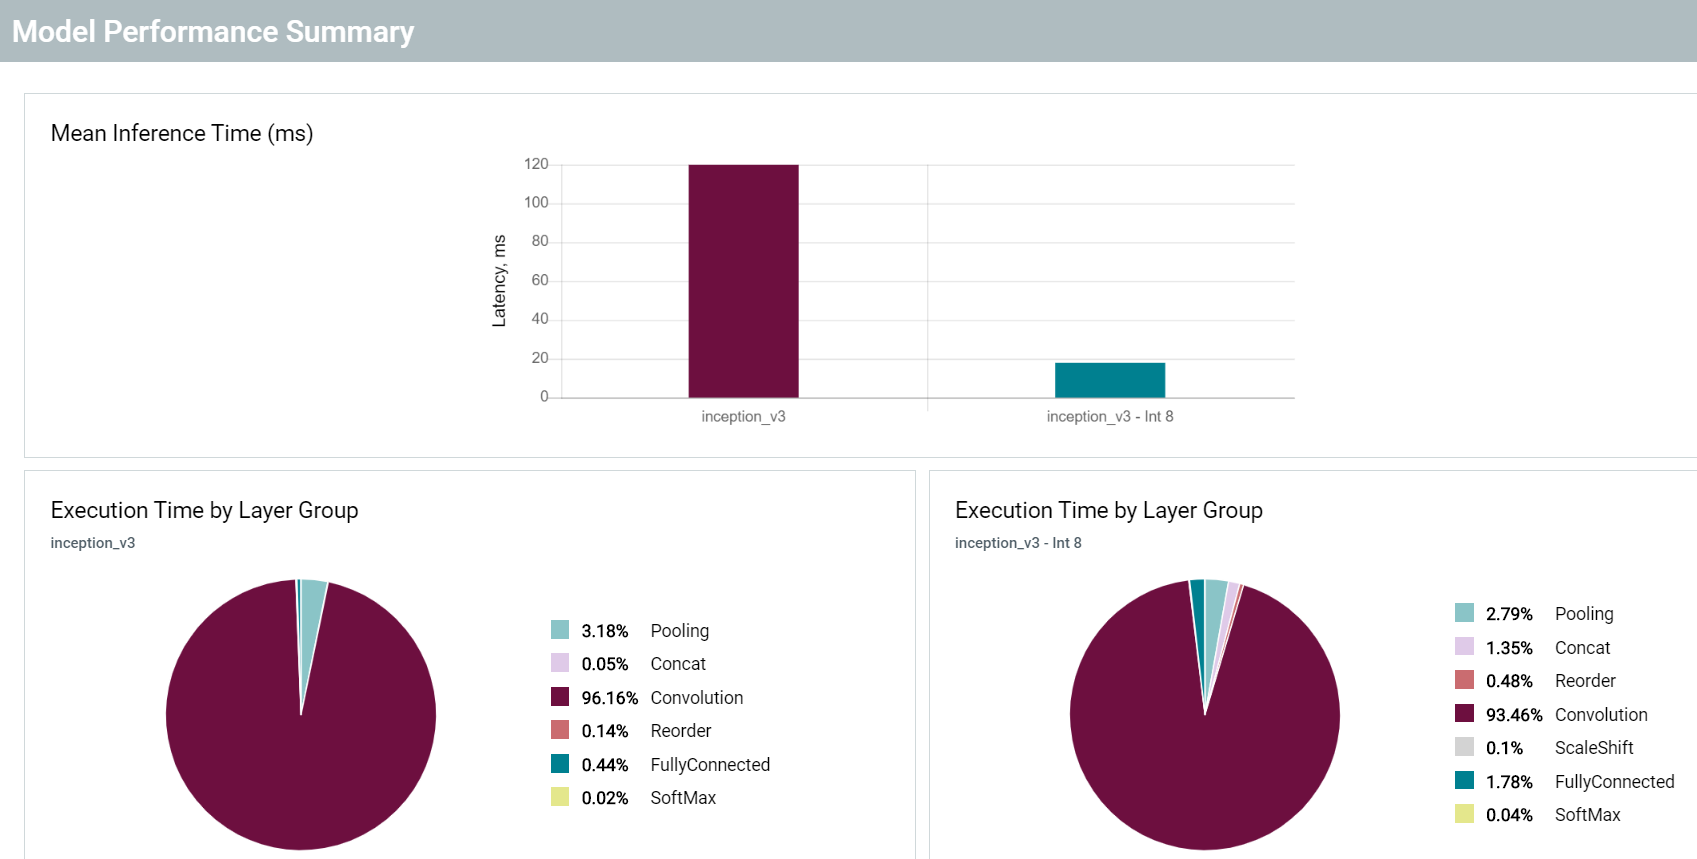
The color of a bar on the graphs corresponds to the color of a selected point:
NOTE: Click on a point again to deselect an inference.
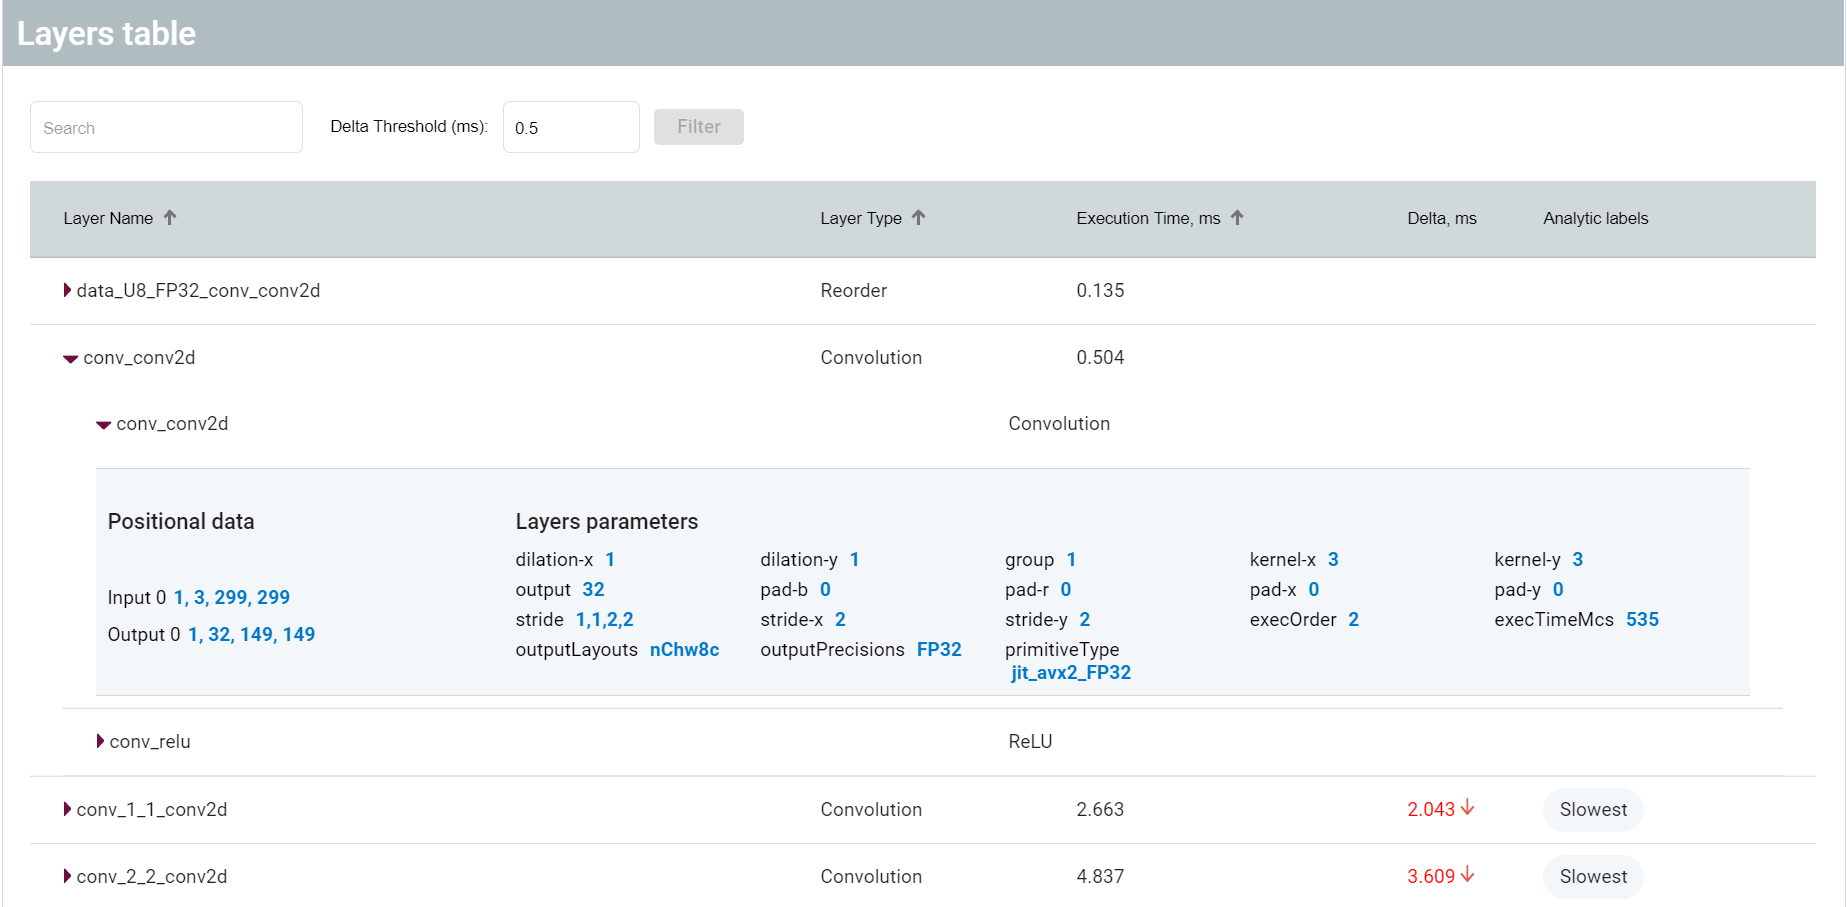
The Layers Table shows each layer of a model. For those layers that differ between versions of a model, top-level rows represent layers of a model during its runtime, while subrows correspond to the layers of an original IR. Gray areas show combined properties for layers of versions. The layer parameter primitiveType shows a selected primitive type, and the outputPrecisions parameter corresponds to the precision of a model.
By entering a number into the Delta Threshold box, you can filter out layers that exceed the threshold you specify. By default, the value is set at 0.5 ms.